Explore and Clean Data at Ninjacat
About the Project
Ninjacat customers often struggle with data issues, spending hours each month troubleshooting, copying changes, and dealing with system slowdowns. This project aims to make it easier for customers to explore and edit large datasets, helping them generate reports more efficiently and accurately.
What is Ninjacat?
NinjaCat is an analytics tool that helps marketing agencies streamline their digital marketing by unifying data in one place. It organizes marketing information, enabling users to easily create reports and monitor performance.
Challenge
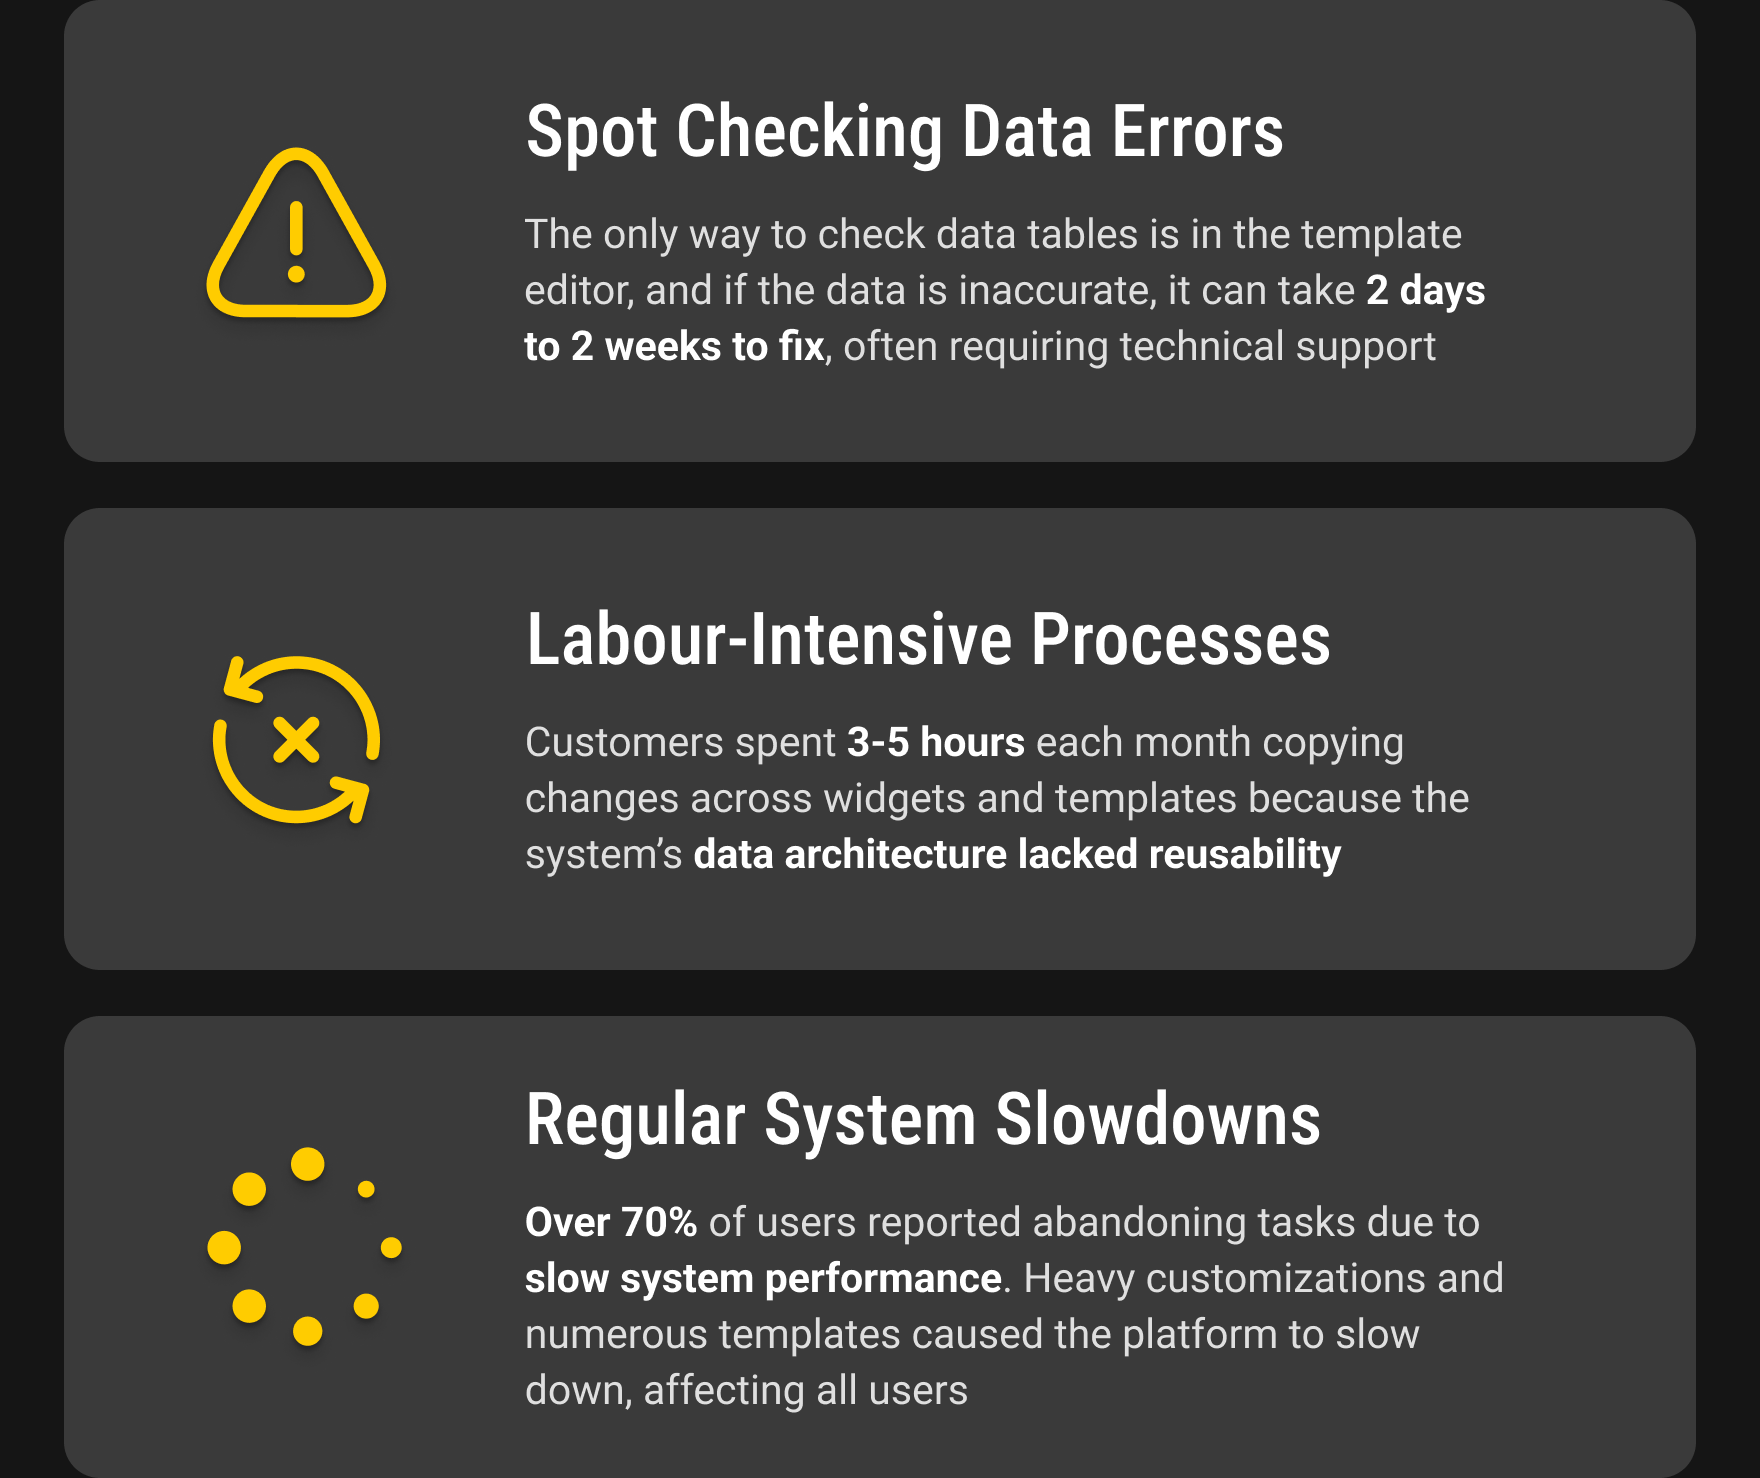
Customer Success and Technical Support tickets soared due to many customers struggling with labor-intensive manual updates, long delays in fixing data errors, and major system slowdowns. In short, customers are finding it difficult to clean large data sets in the original Ninjacat system.
Key Findings
To address those challenges, the Product Manager and I conducted interviews with 5 internal and 6 external stakeholders over 2 weeks and reviewed 150+ support tickets. This research uncovered 3 key findings into the root causes of slow performance and inefficient workflows.
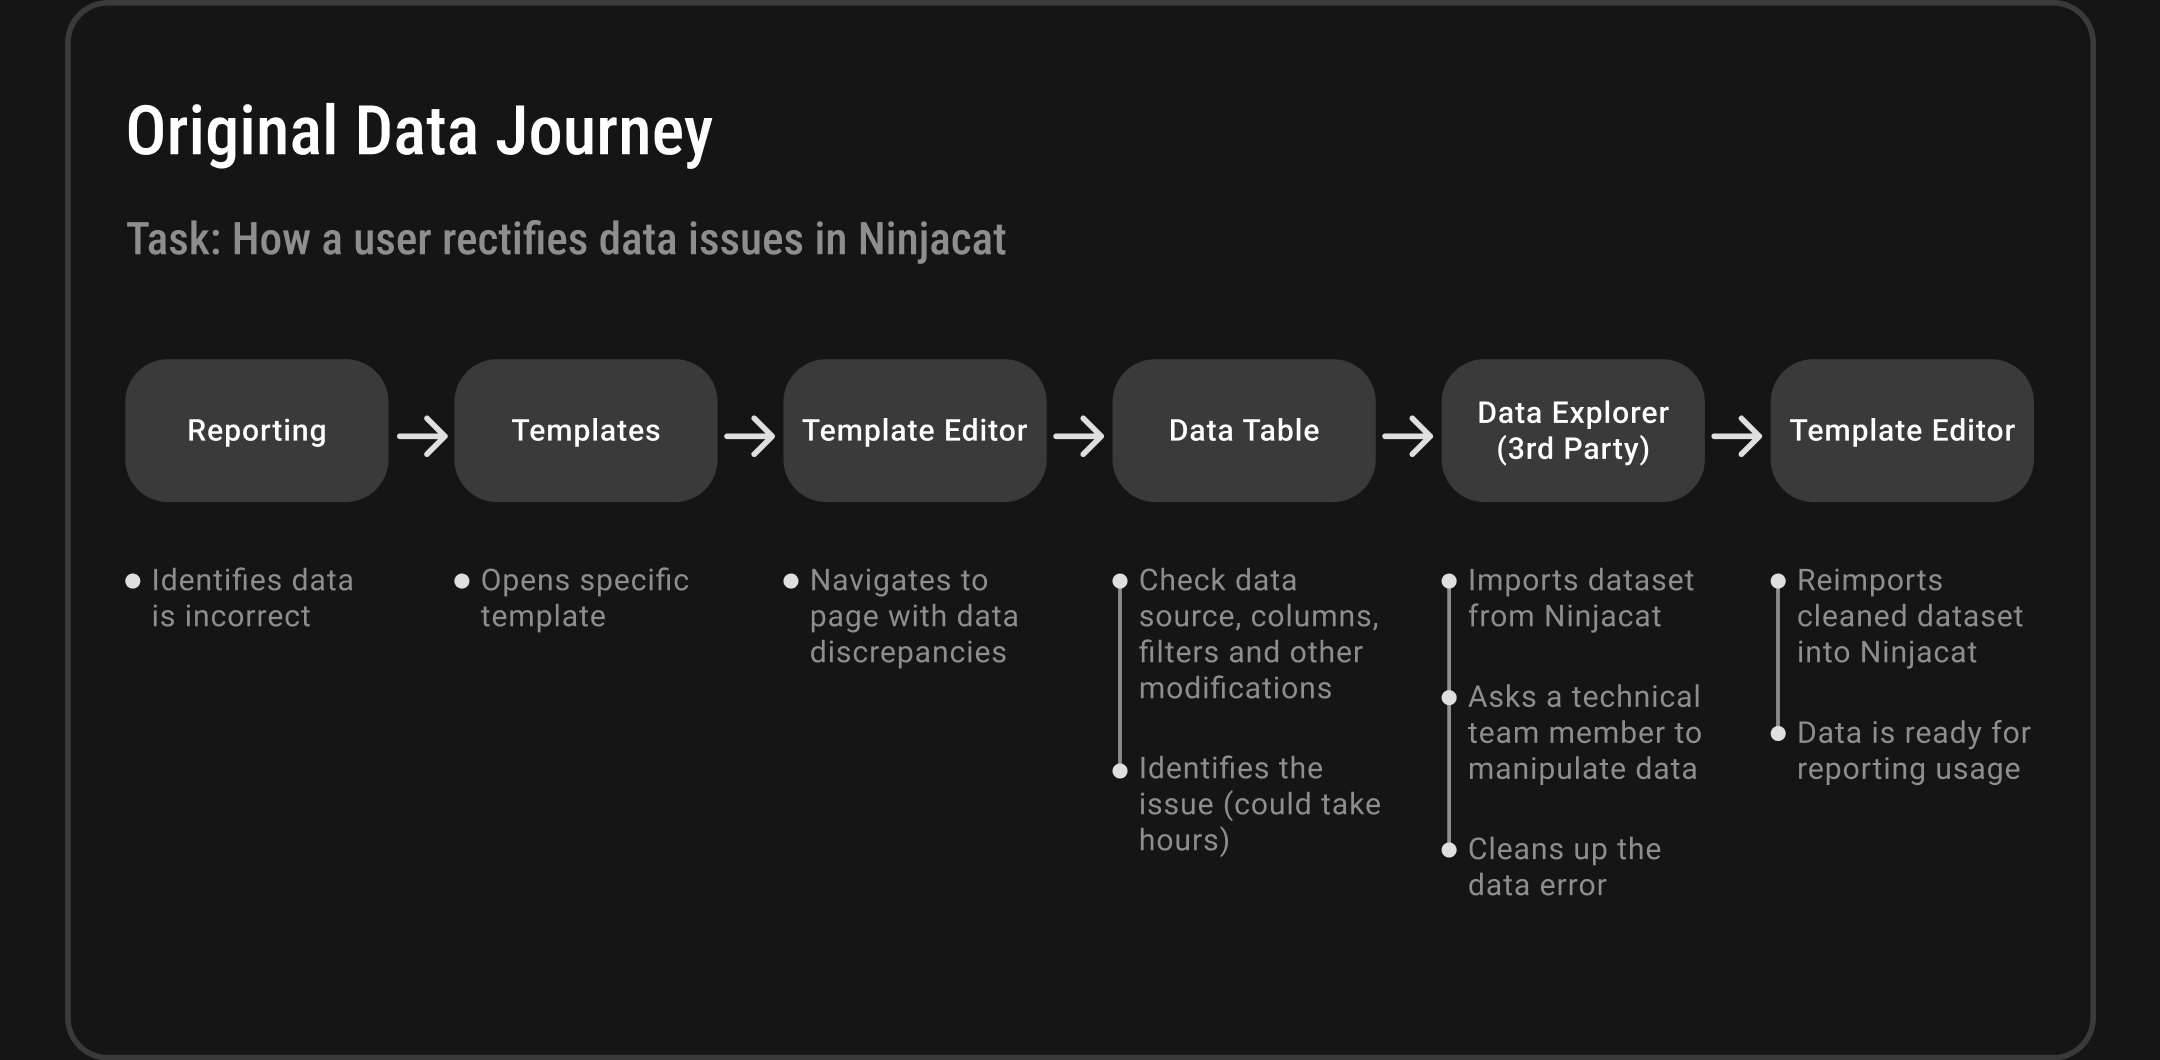
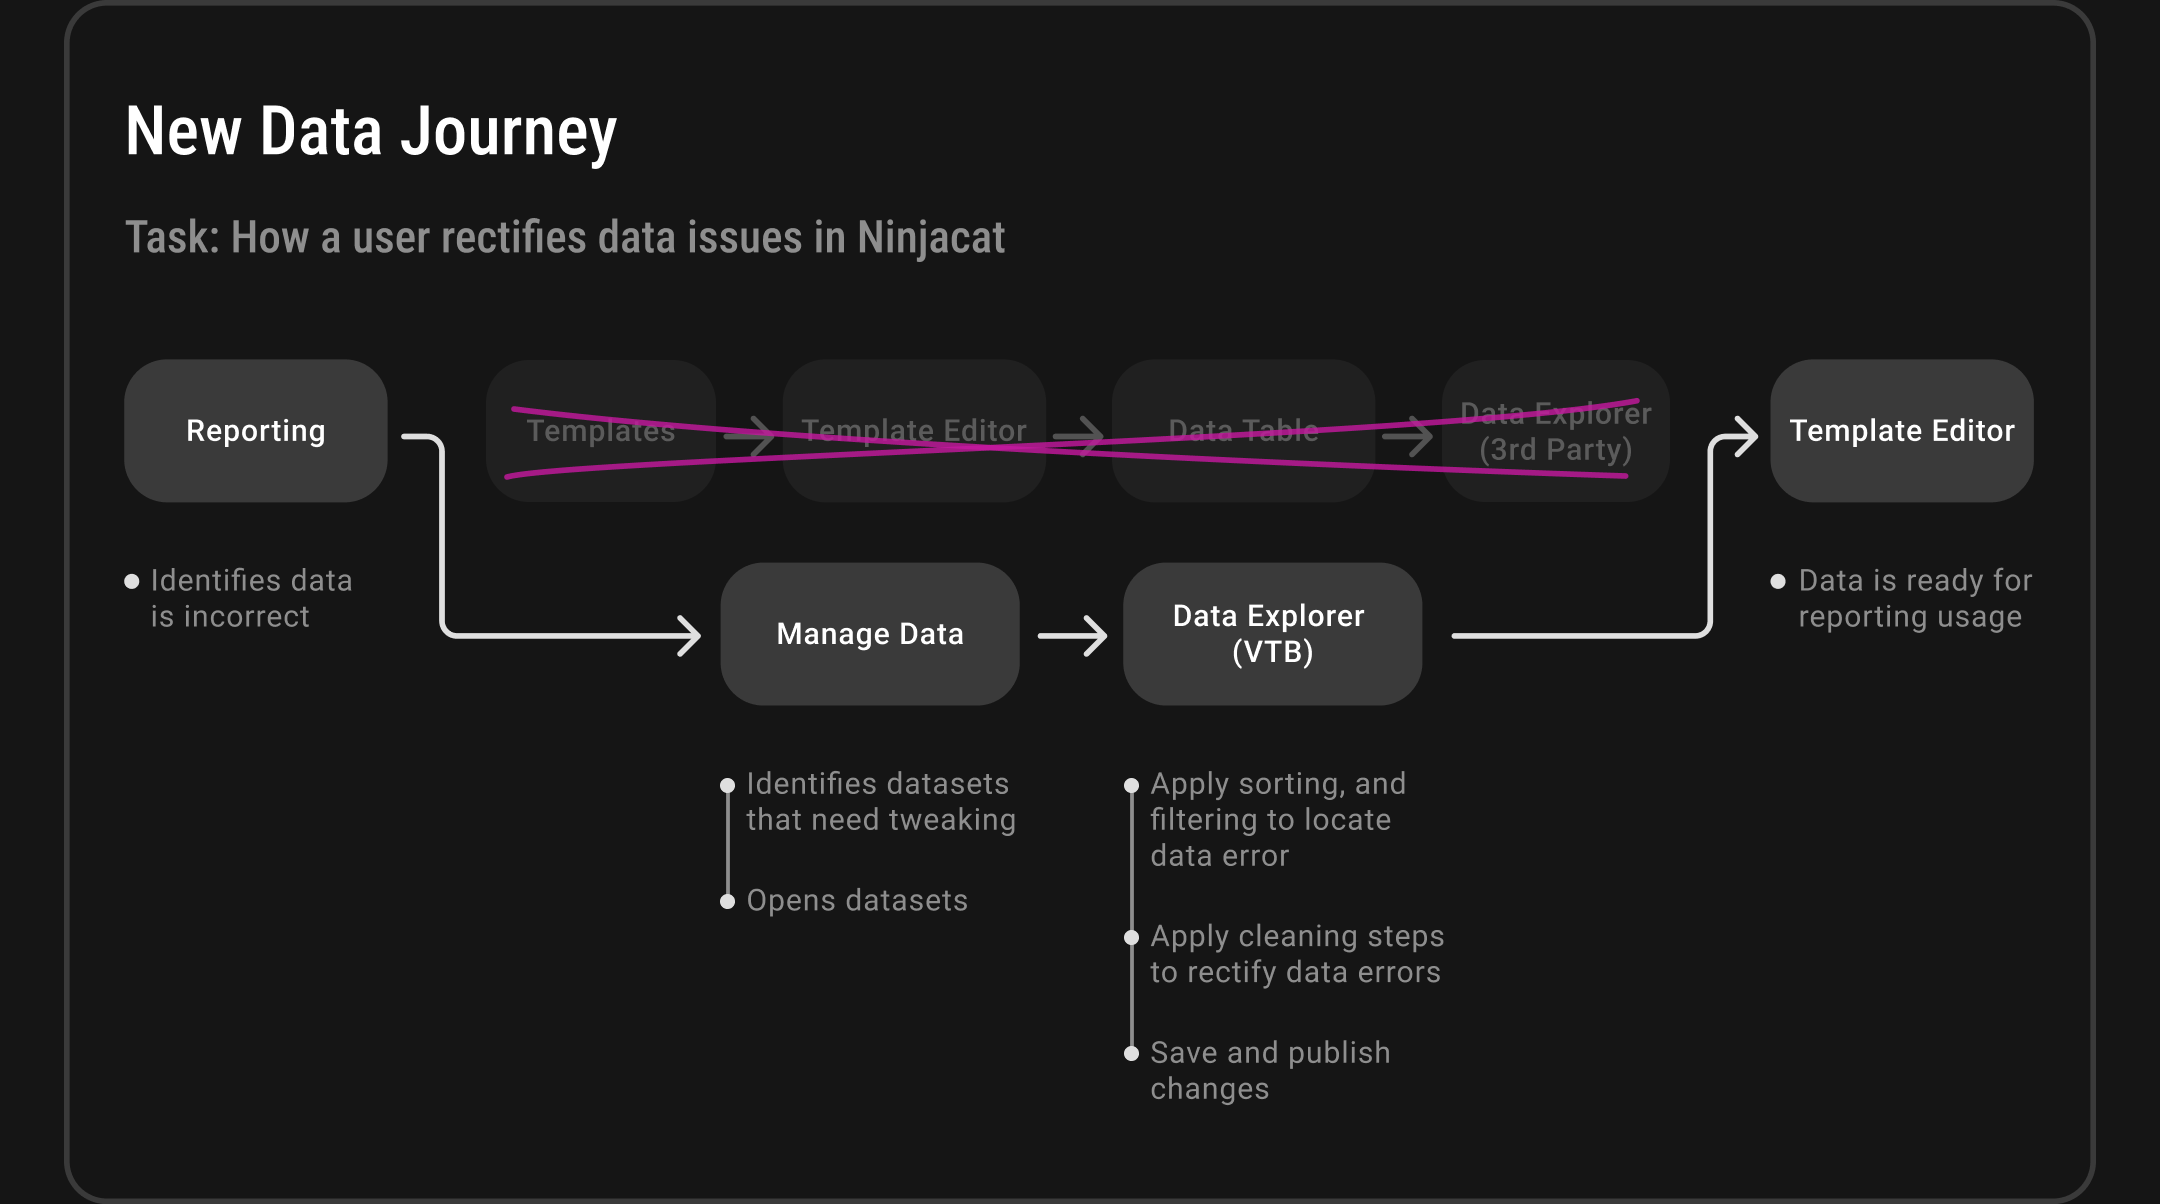
The Core Problem: NinjaCat's Data Architecture Bottleneck
NinjaCat's original data workflow forced all modifications through a template editor, creating a system-wide bottleneck. Working with the Chief Architect and CTO, we streamlined the process from 6 steps to 4 steps by implementing a dedicated data management interface and built-in Data Explorer. This eliminated the need for third-party tools and gave users direct control over their data, significantly improving system performance and user efficiency.
Users We Interviewed
Digital Marketing Managers use Ninjacat to generate accurate, time-sensitive reports for their clients. They rely on Ninjacat to tell compelling data stories but may lack the technical skills to create and modify their own datasets.

Project Goal
The goal of this project is to empower customers to explore and modify their large datasets more easily, ensuring they can generate accurate reports in a timely manner.
Design Workshops
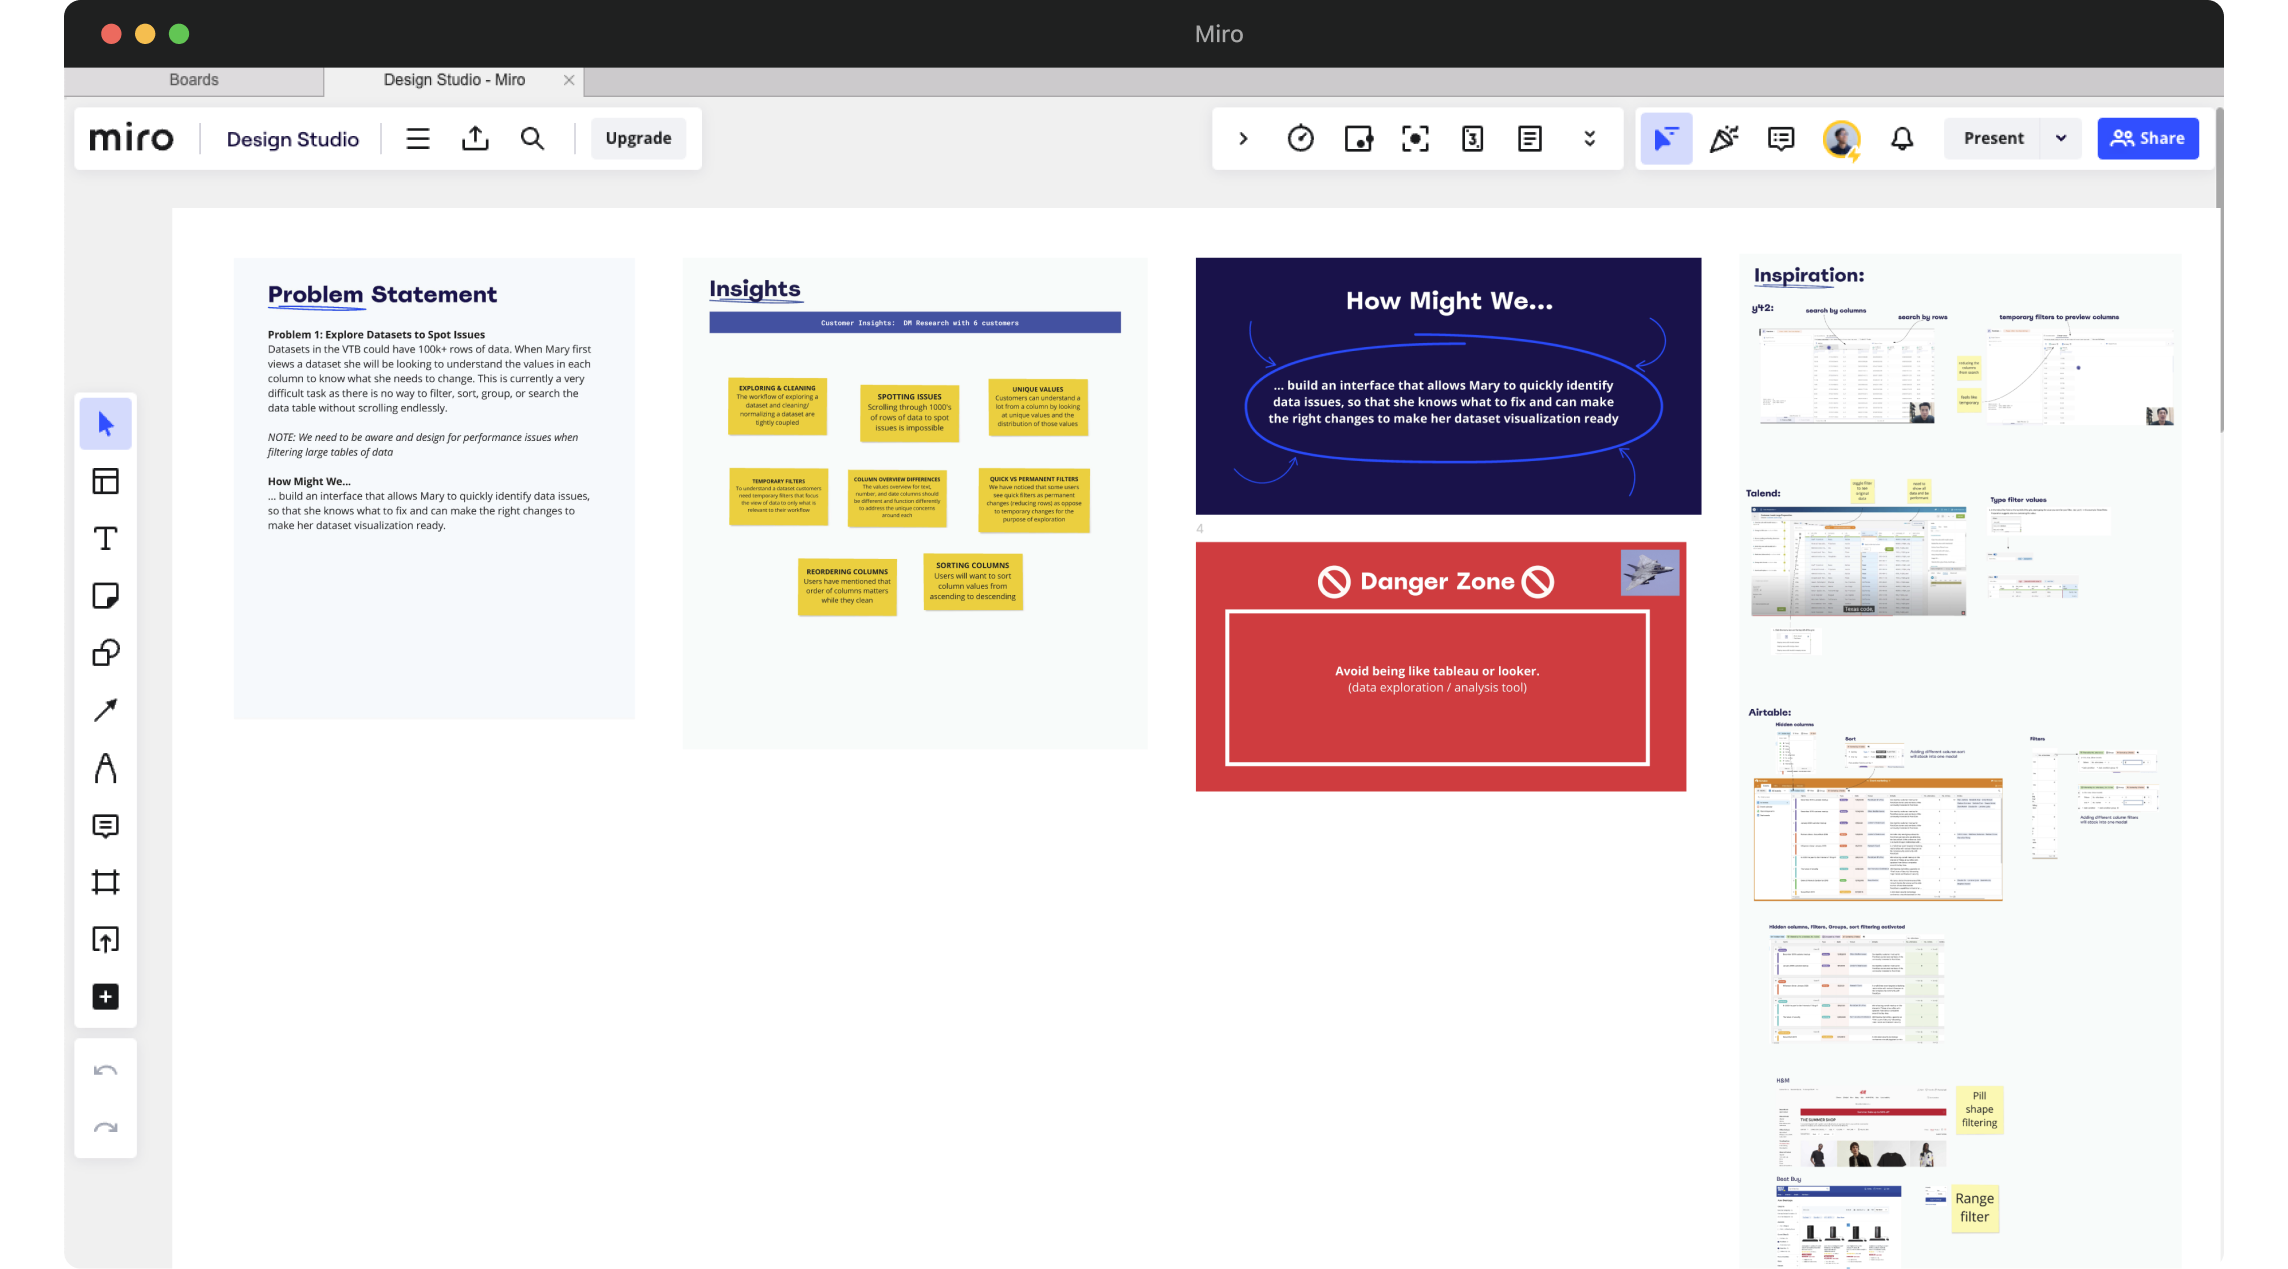
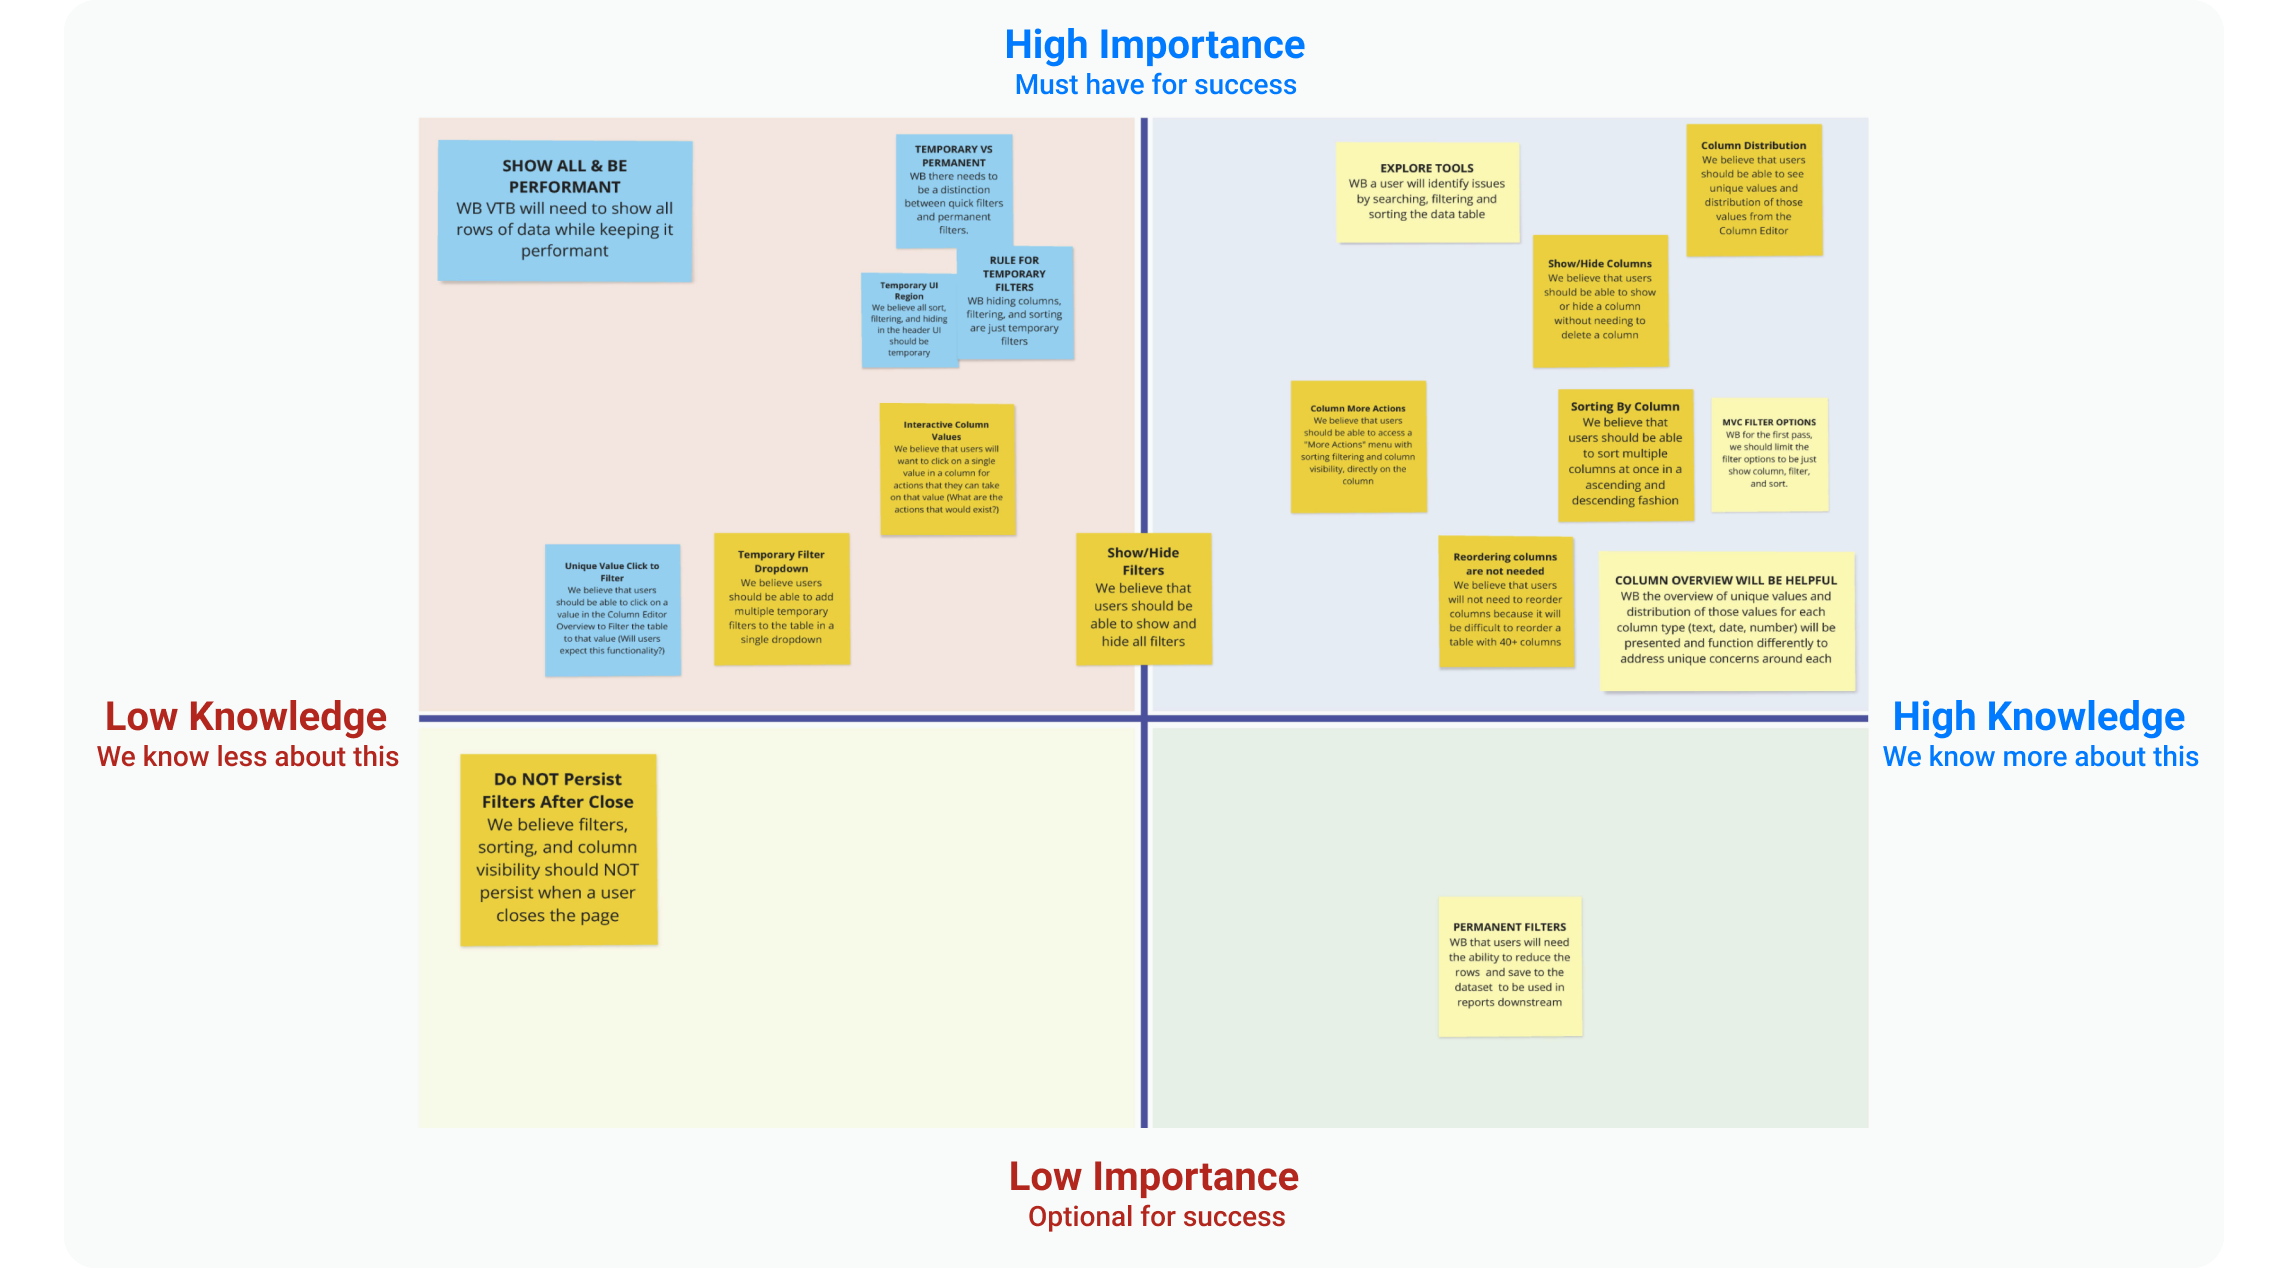
Design workshops are crucial to align cross-functional teams on what to build, ensuring a balance between business goals and user needs. I hosted design workshops with Product Manager, Engineers, and key stakeholders, where I shared insights, goals, problem statements, and competitive analysis. At these design workshops, collaborators sketched, voted, and shared ideas. We collected the most voted notes, plotted them on an knowledge/ importance matrix to determine which design ideas need more validations from experiments.
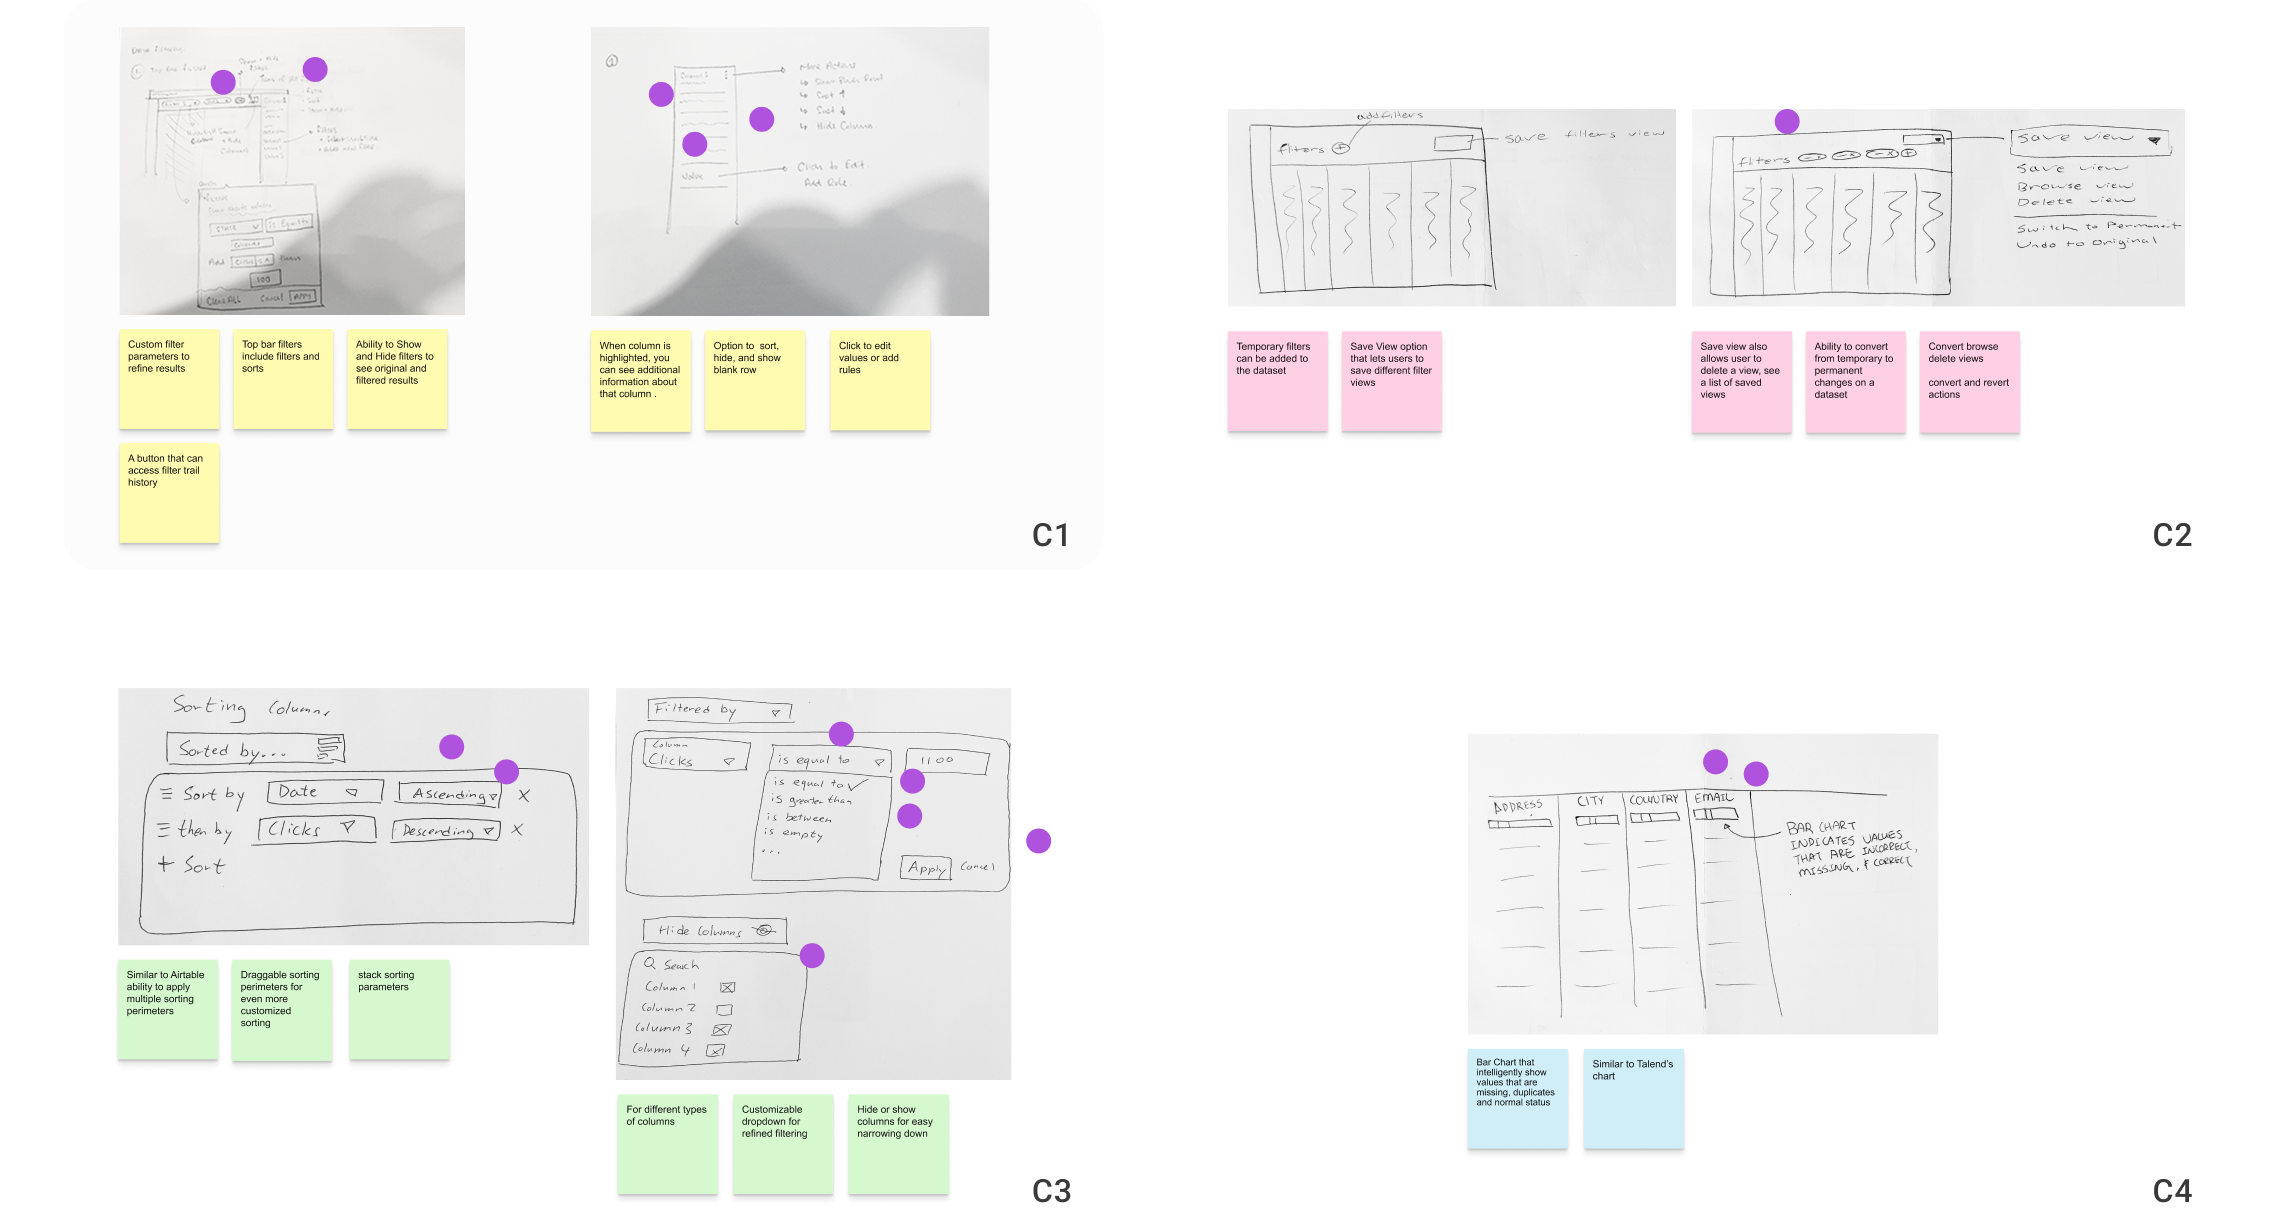
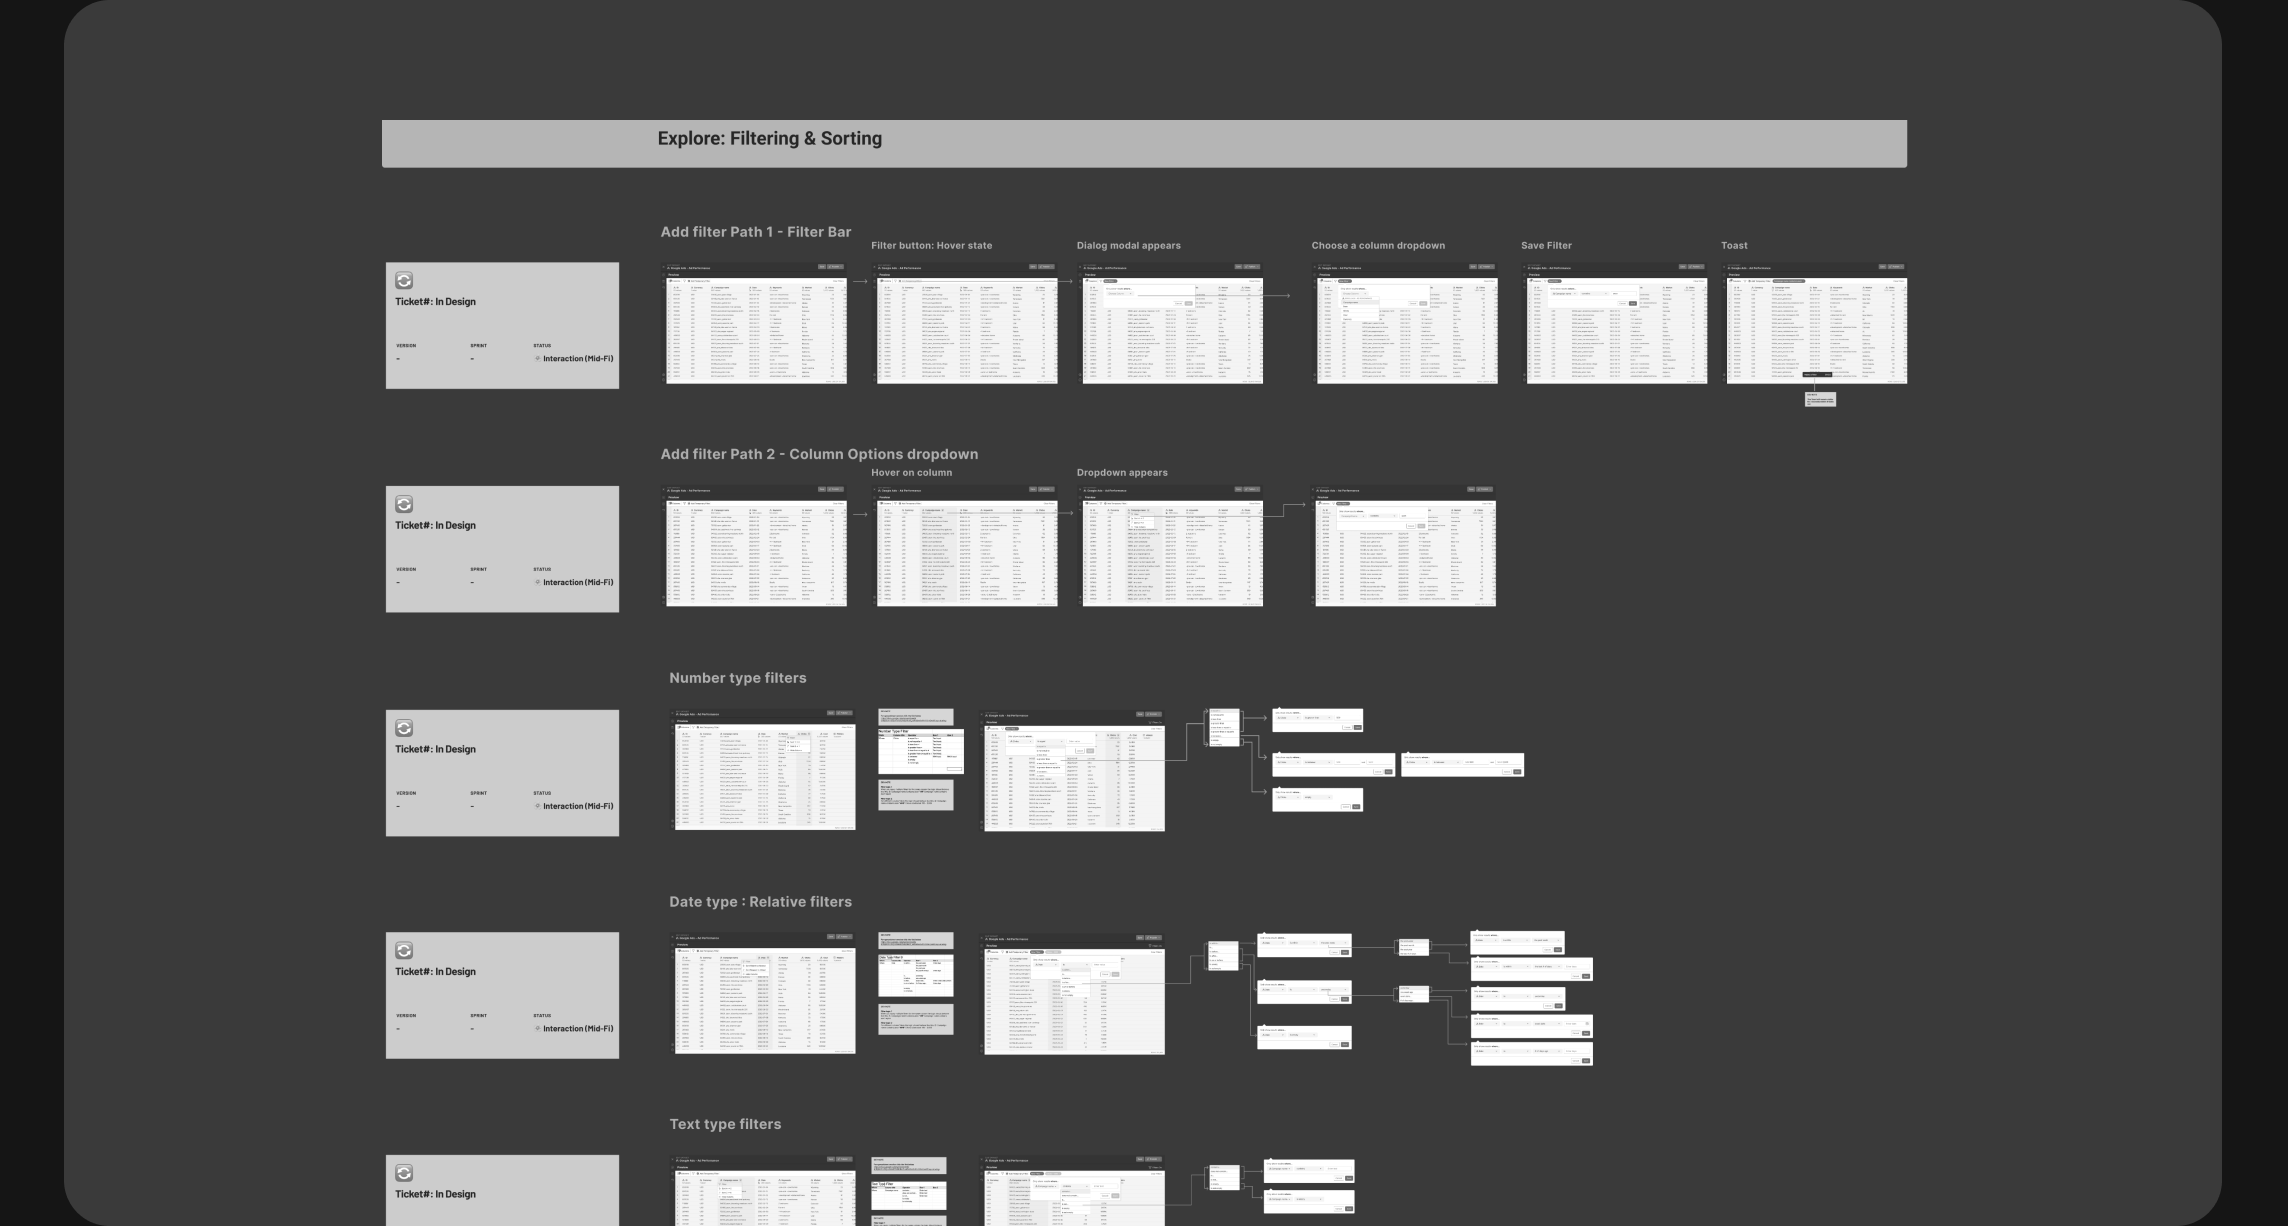
Rapid Prototyping
On a weekly basis, I hosted 30-60 minute design reviews where I collected design and feasibility feedback from my team of engineers and the product manager, occasionally presented progress to leadership, and prioritized feedback that gave high-impact, low-effort designs for the next review.
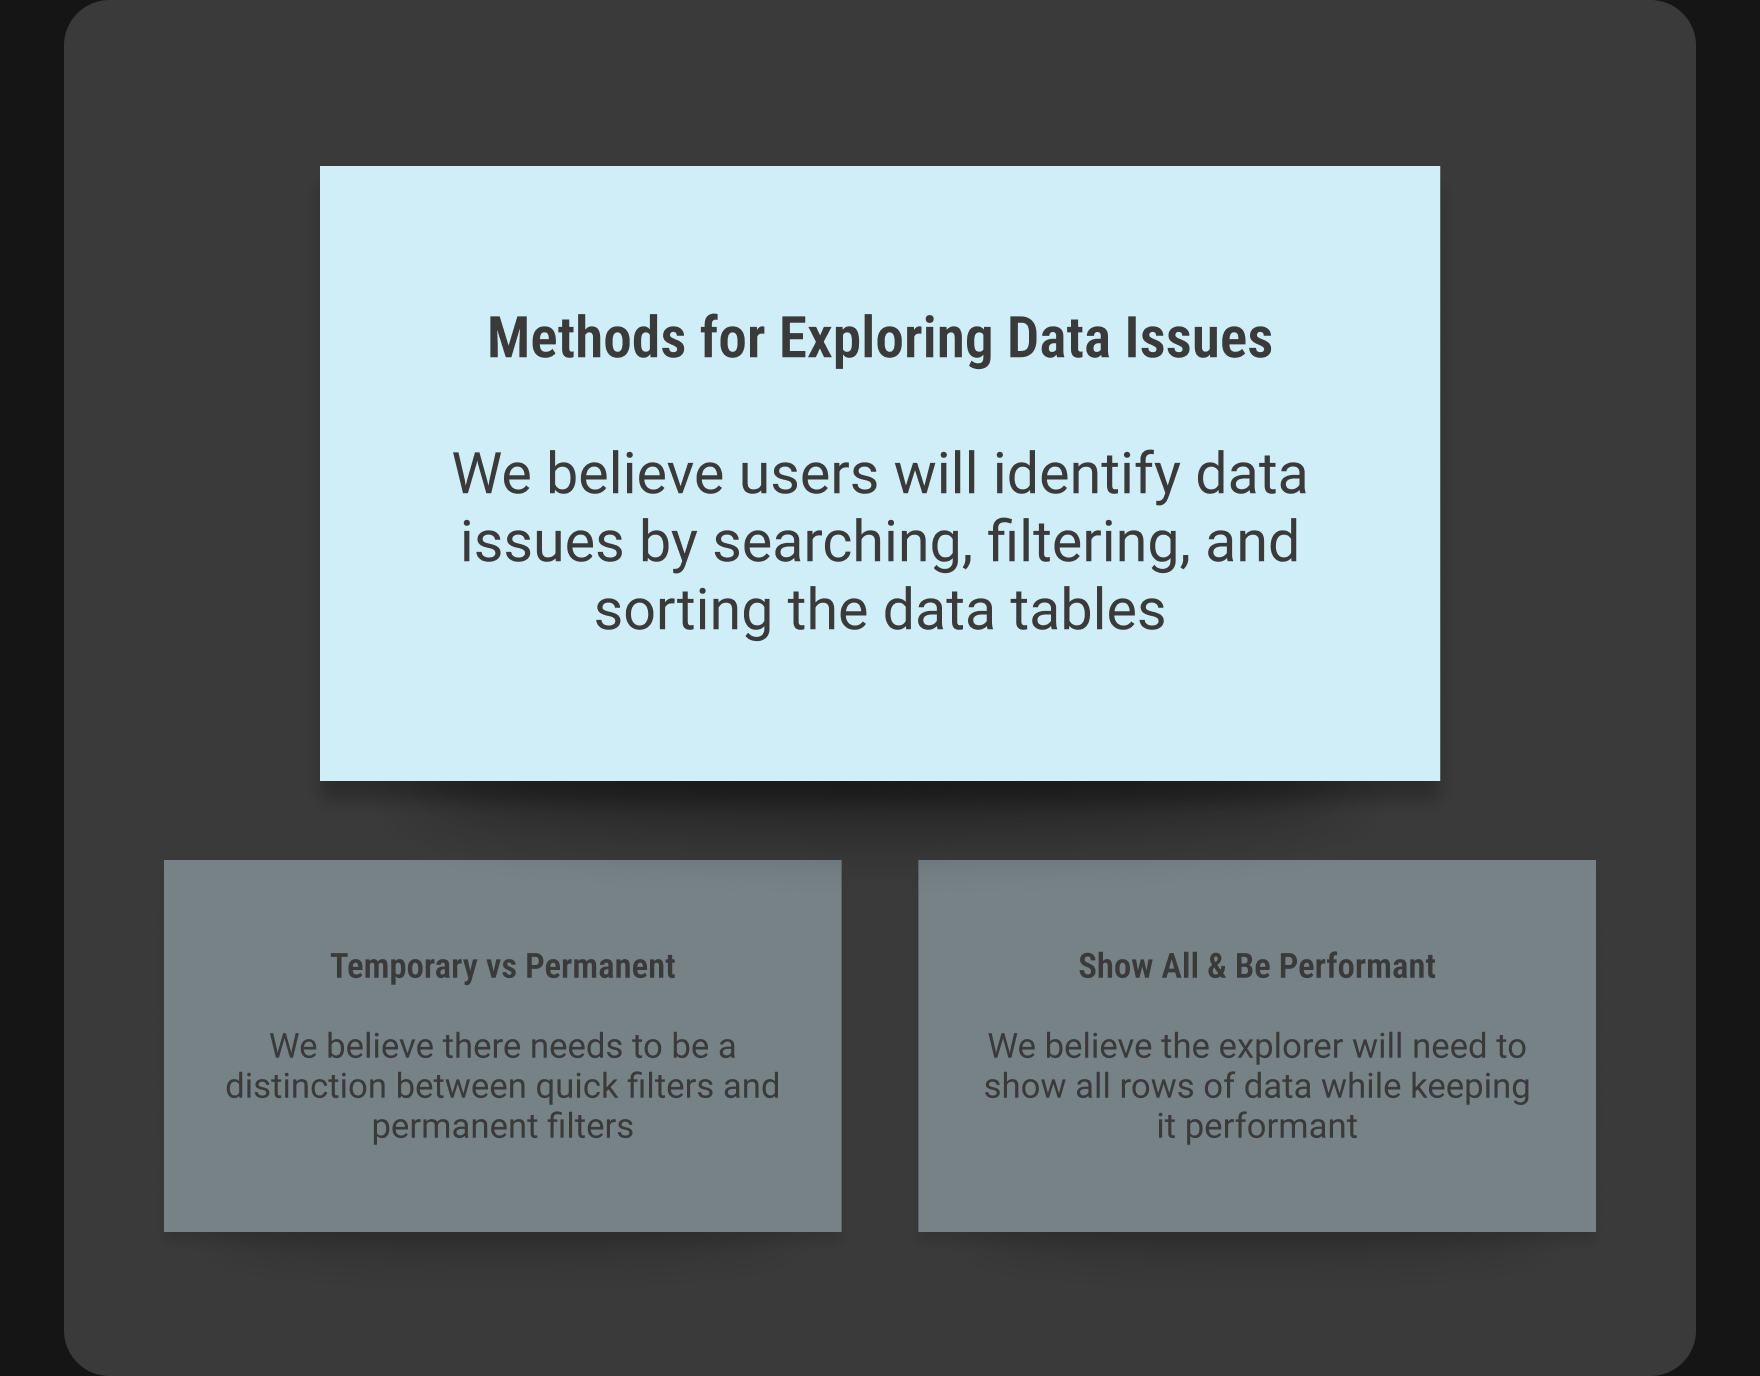
Primary Assumption to Enhance User Efficiency
Among multiple assumptions mapped on our importance/knowledge matrix, we chose to tackle this high impact assumption: "We believe users will identify data issues by searching, filtering, and sorting the data tables."
Voice of Customers
"I wish there was a way to explore datasets quickly in NC (Ninjacat)."
"The lack of data cleansing functionality is making me consider switching platforms."
"Every month, I export data to Tableau for cleaning, then reimport it to Ninjacat and it’s usually a 3-day process for my team…"
Key Questions
• How might we help users quickly spot data problems?
• How might we reduce manual data cleaning effort?
• How might we build user trust in data quality?
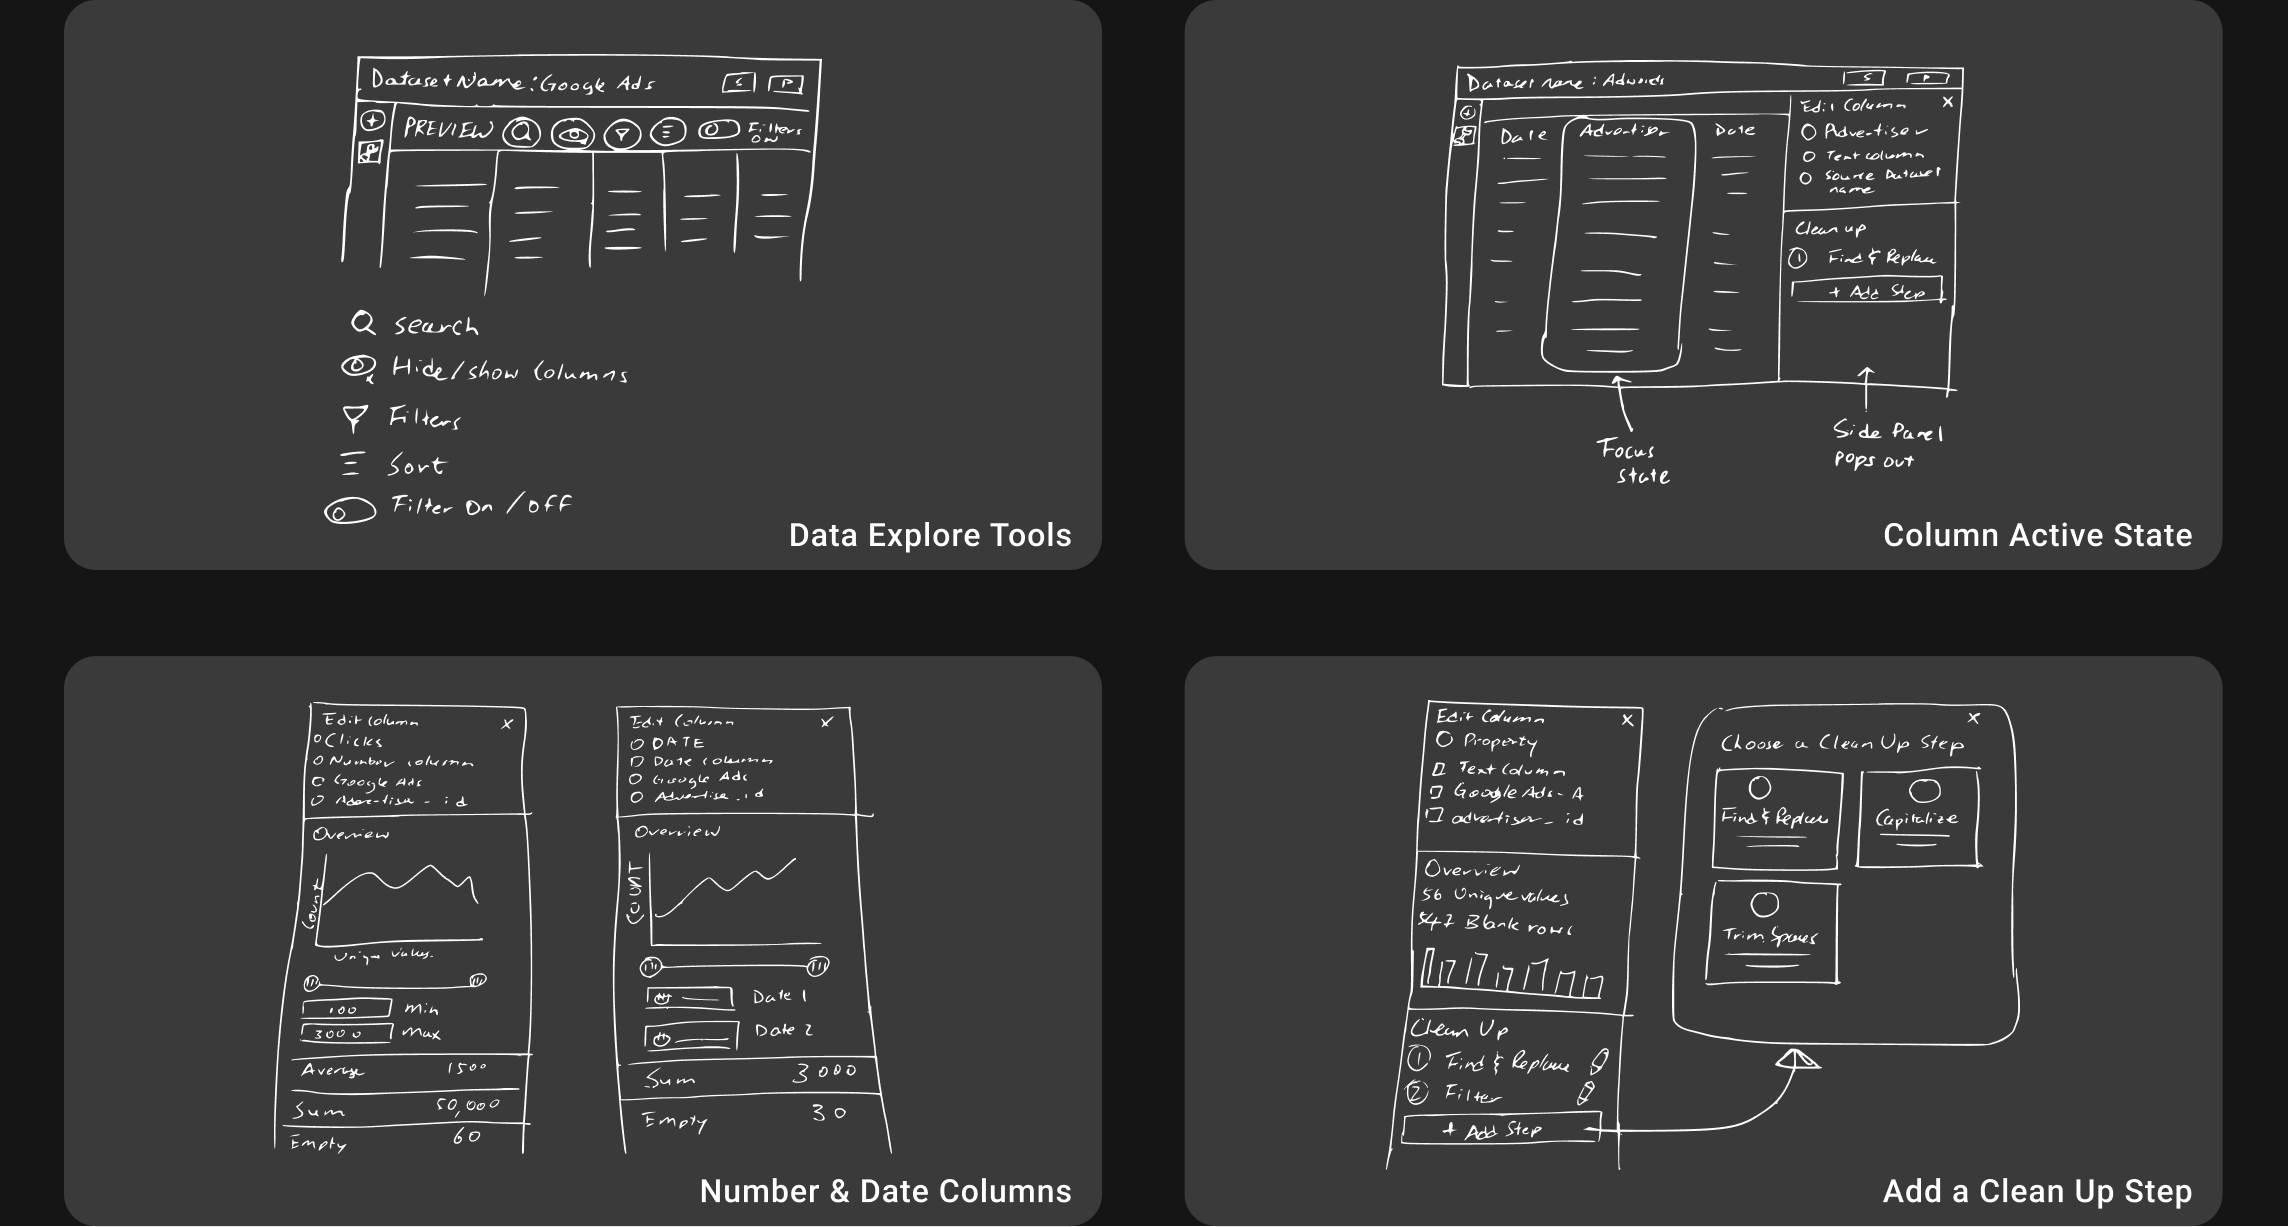
Feature Refinement Through Iterations
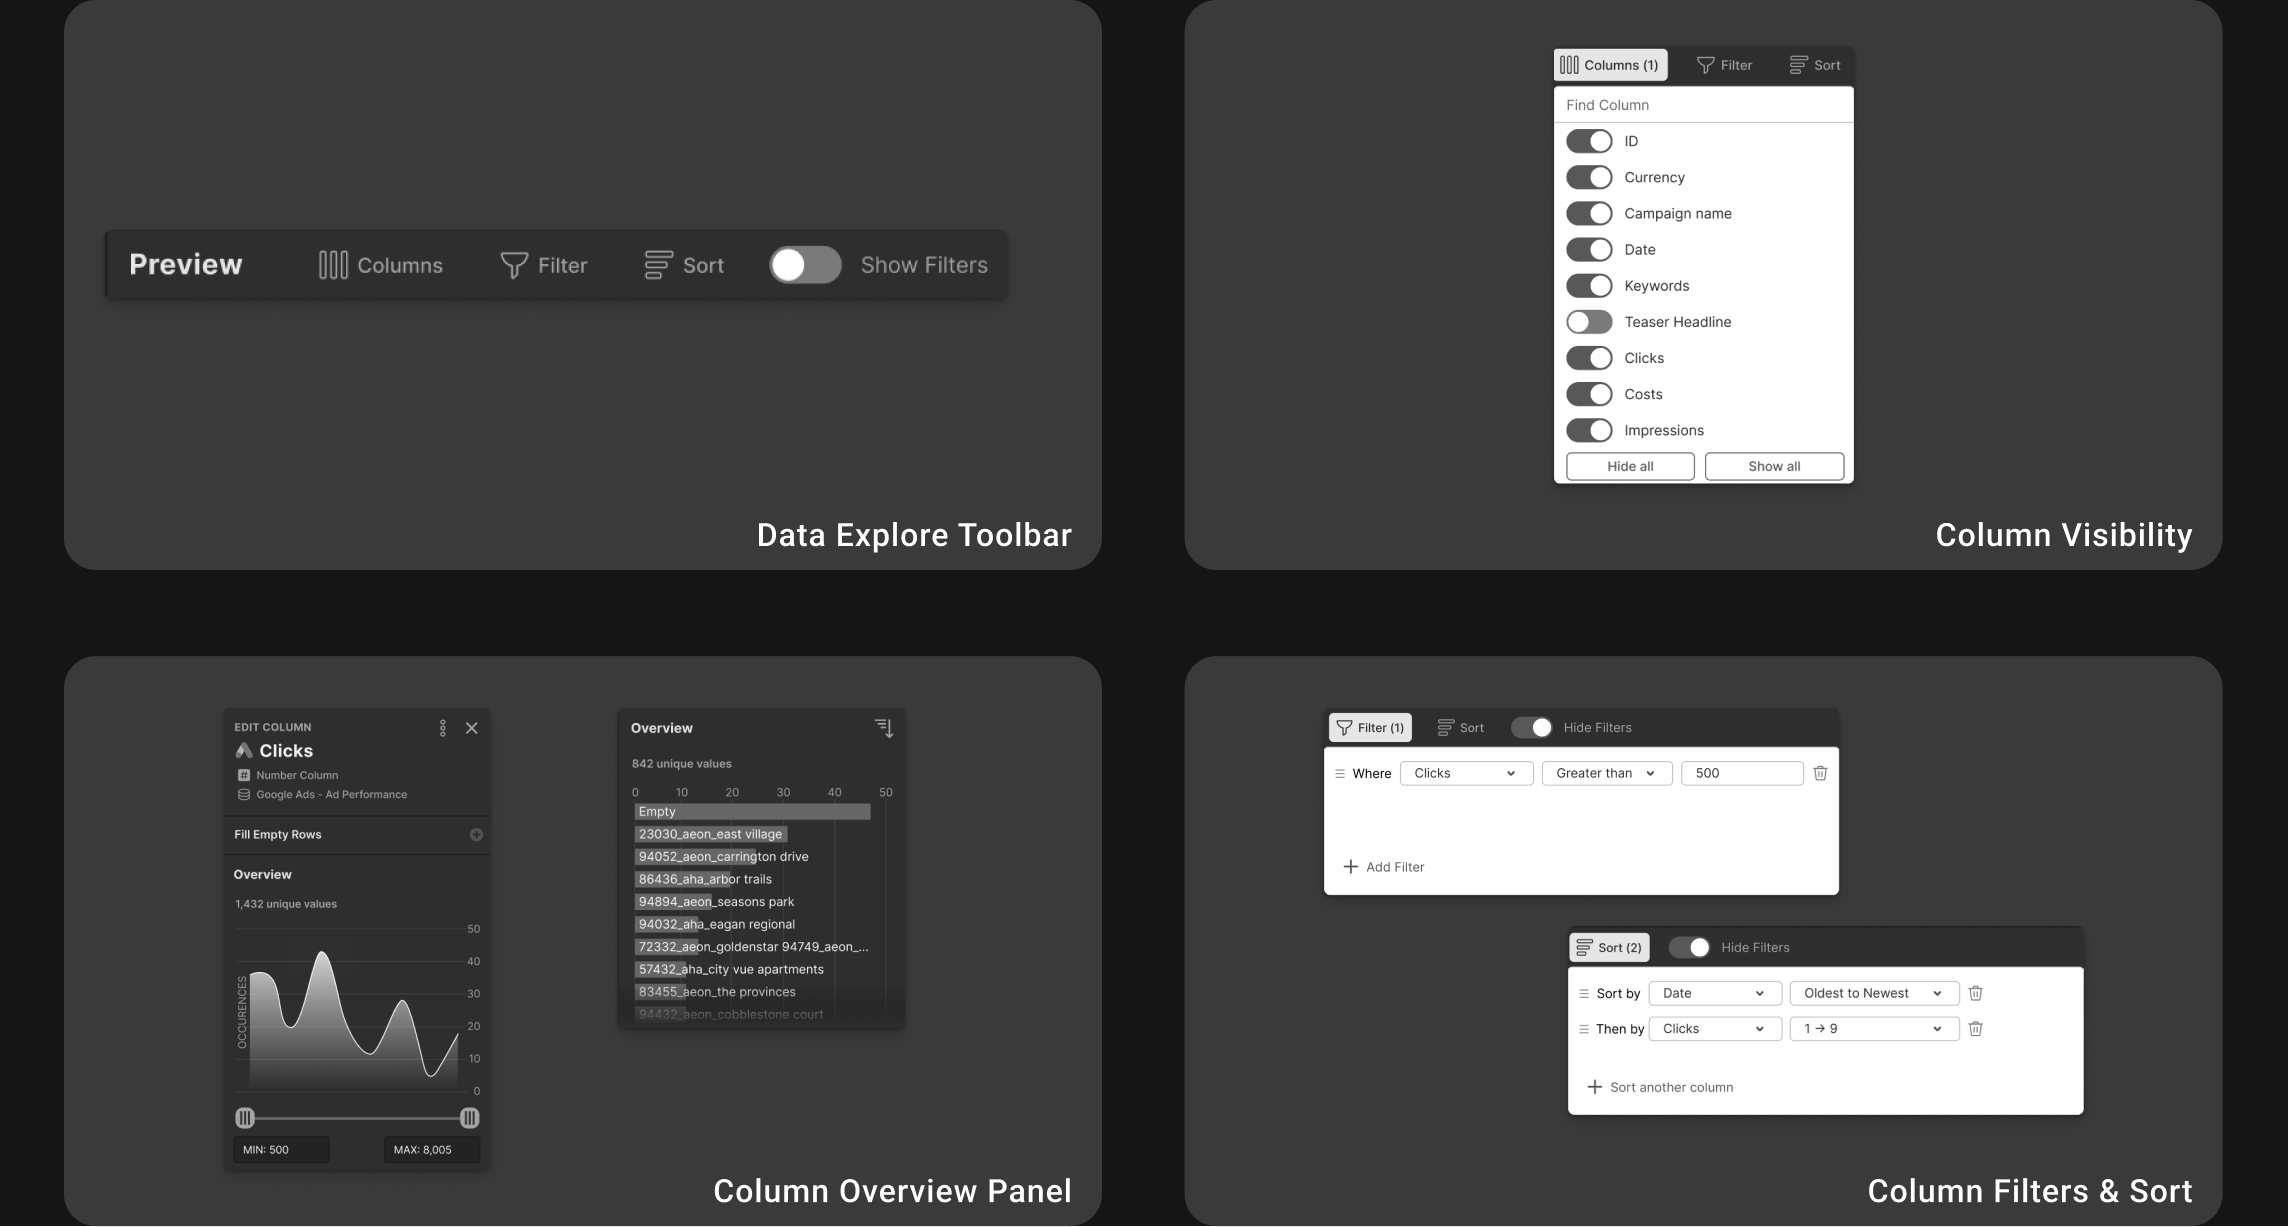
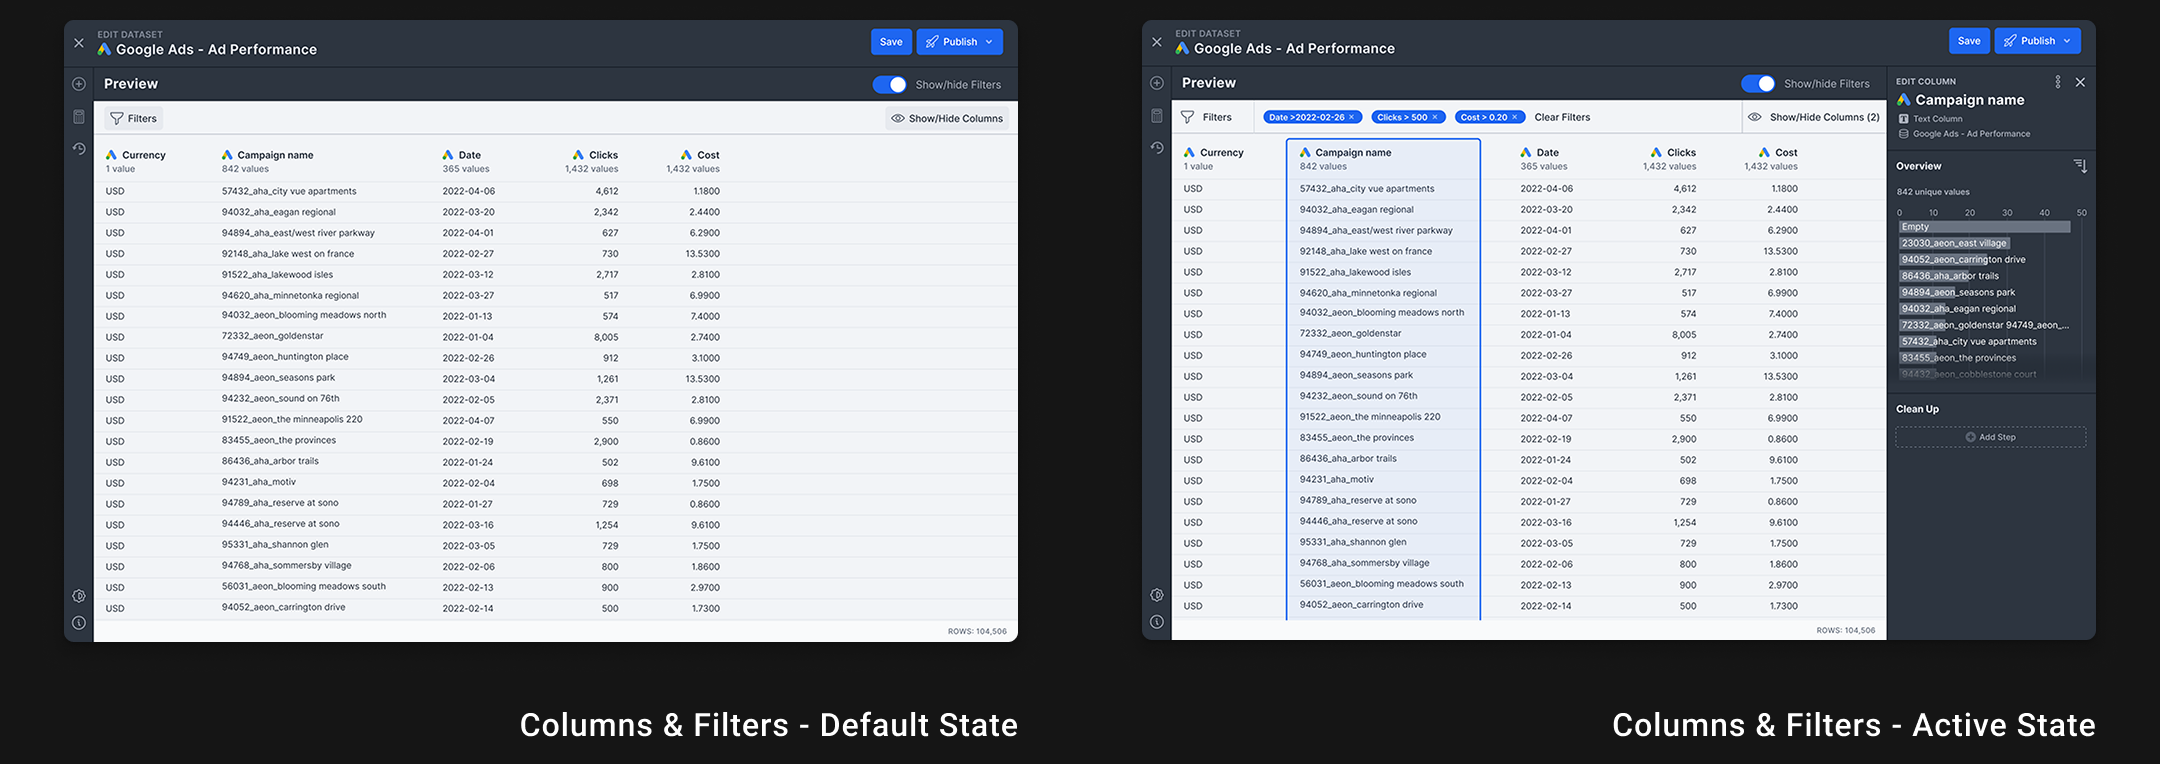
Through competitive analysis and team feedback, we identified essential data exploration features: show/hide columns, filters, sorting, an overview panel, and a value distribution chart.
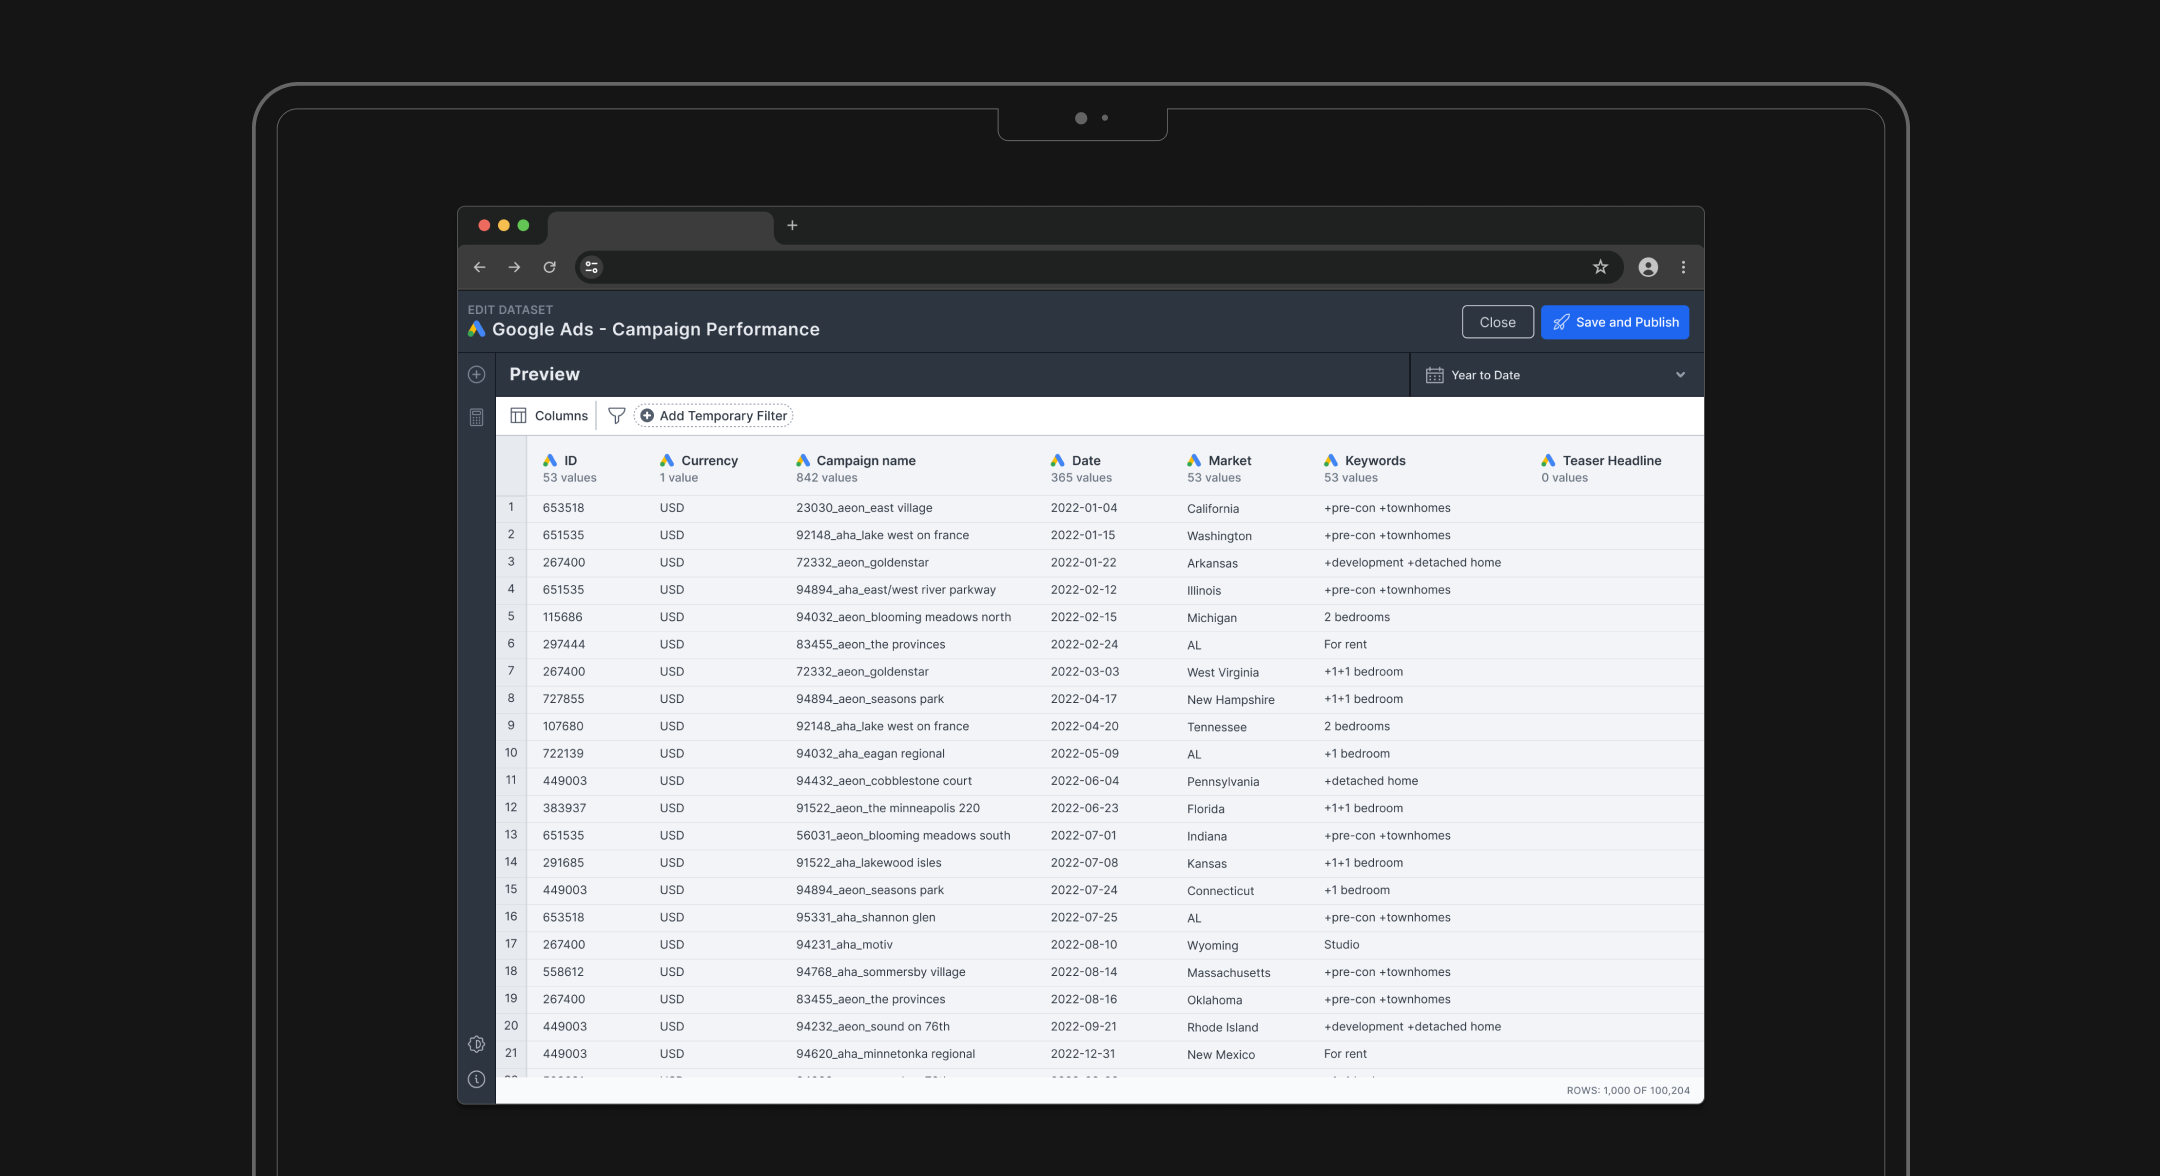
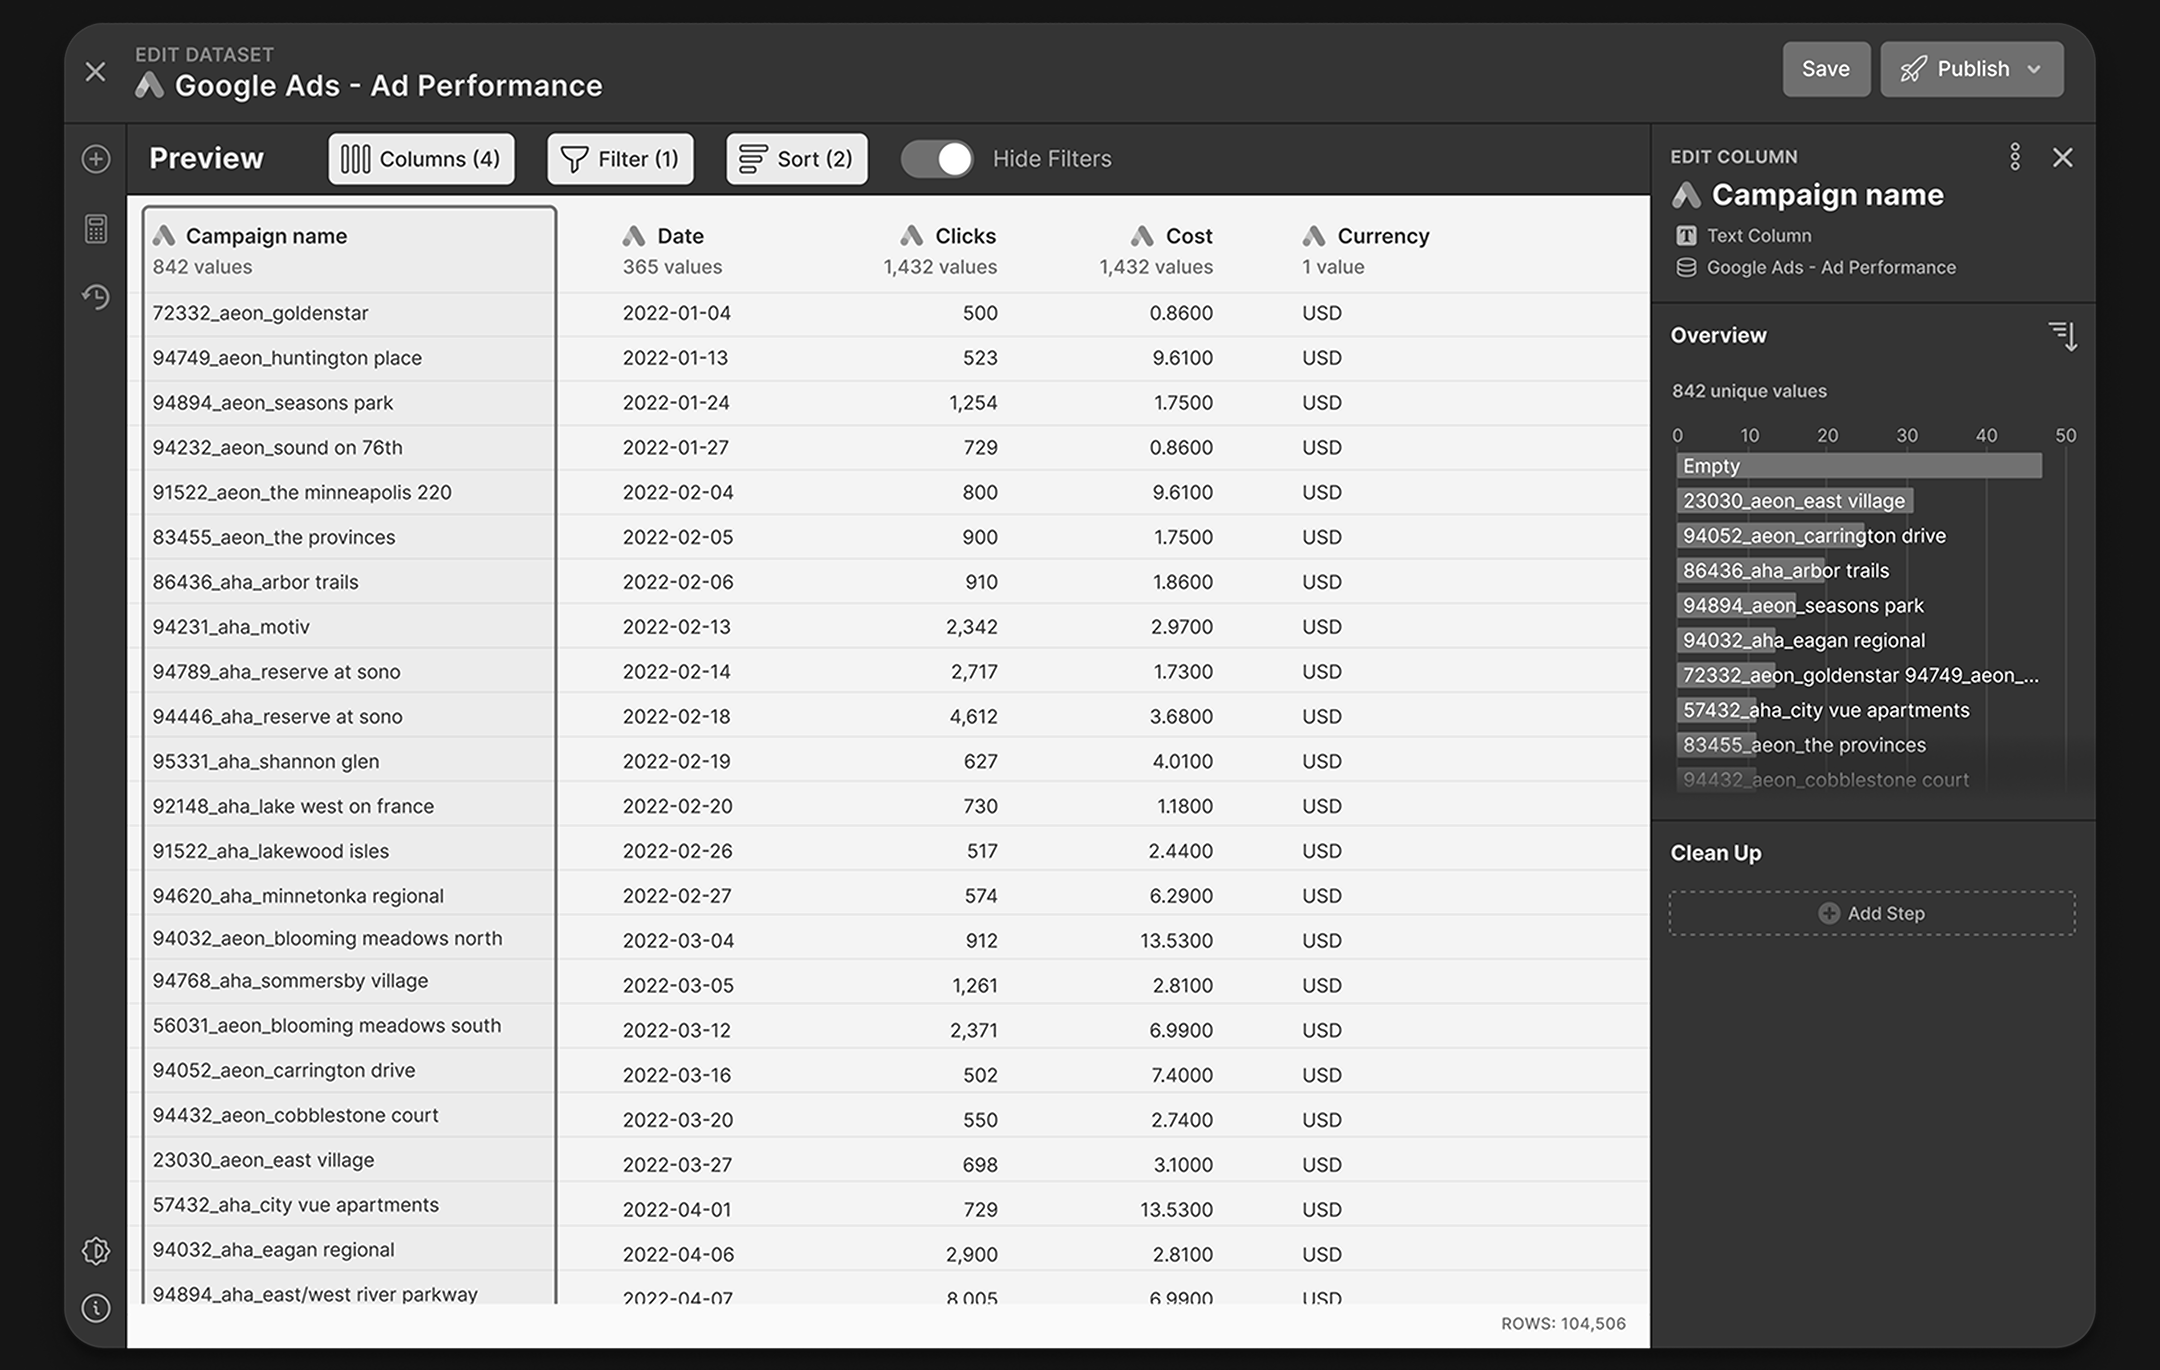
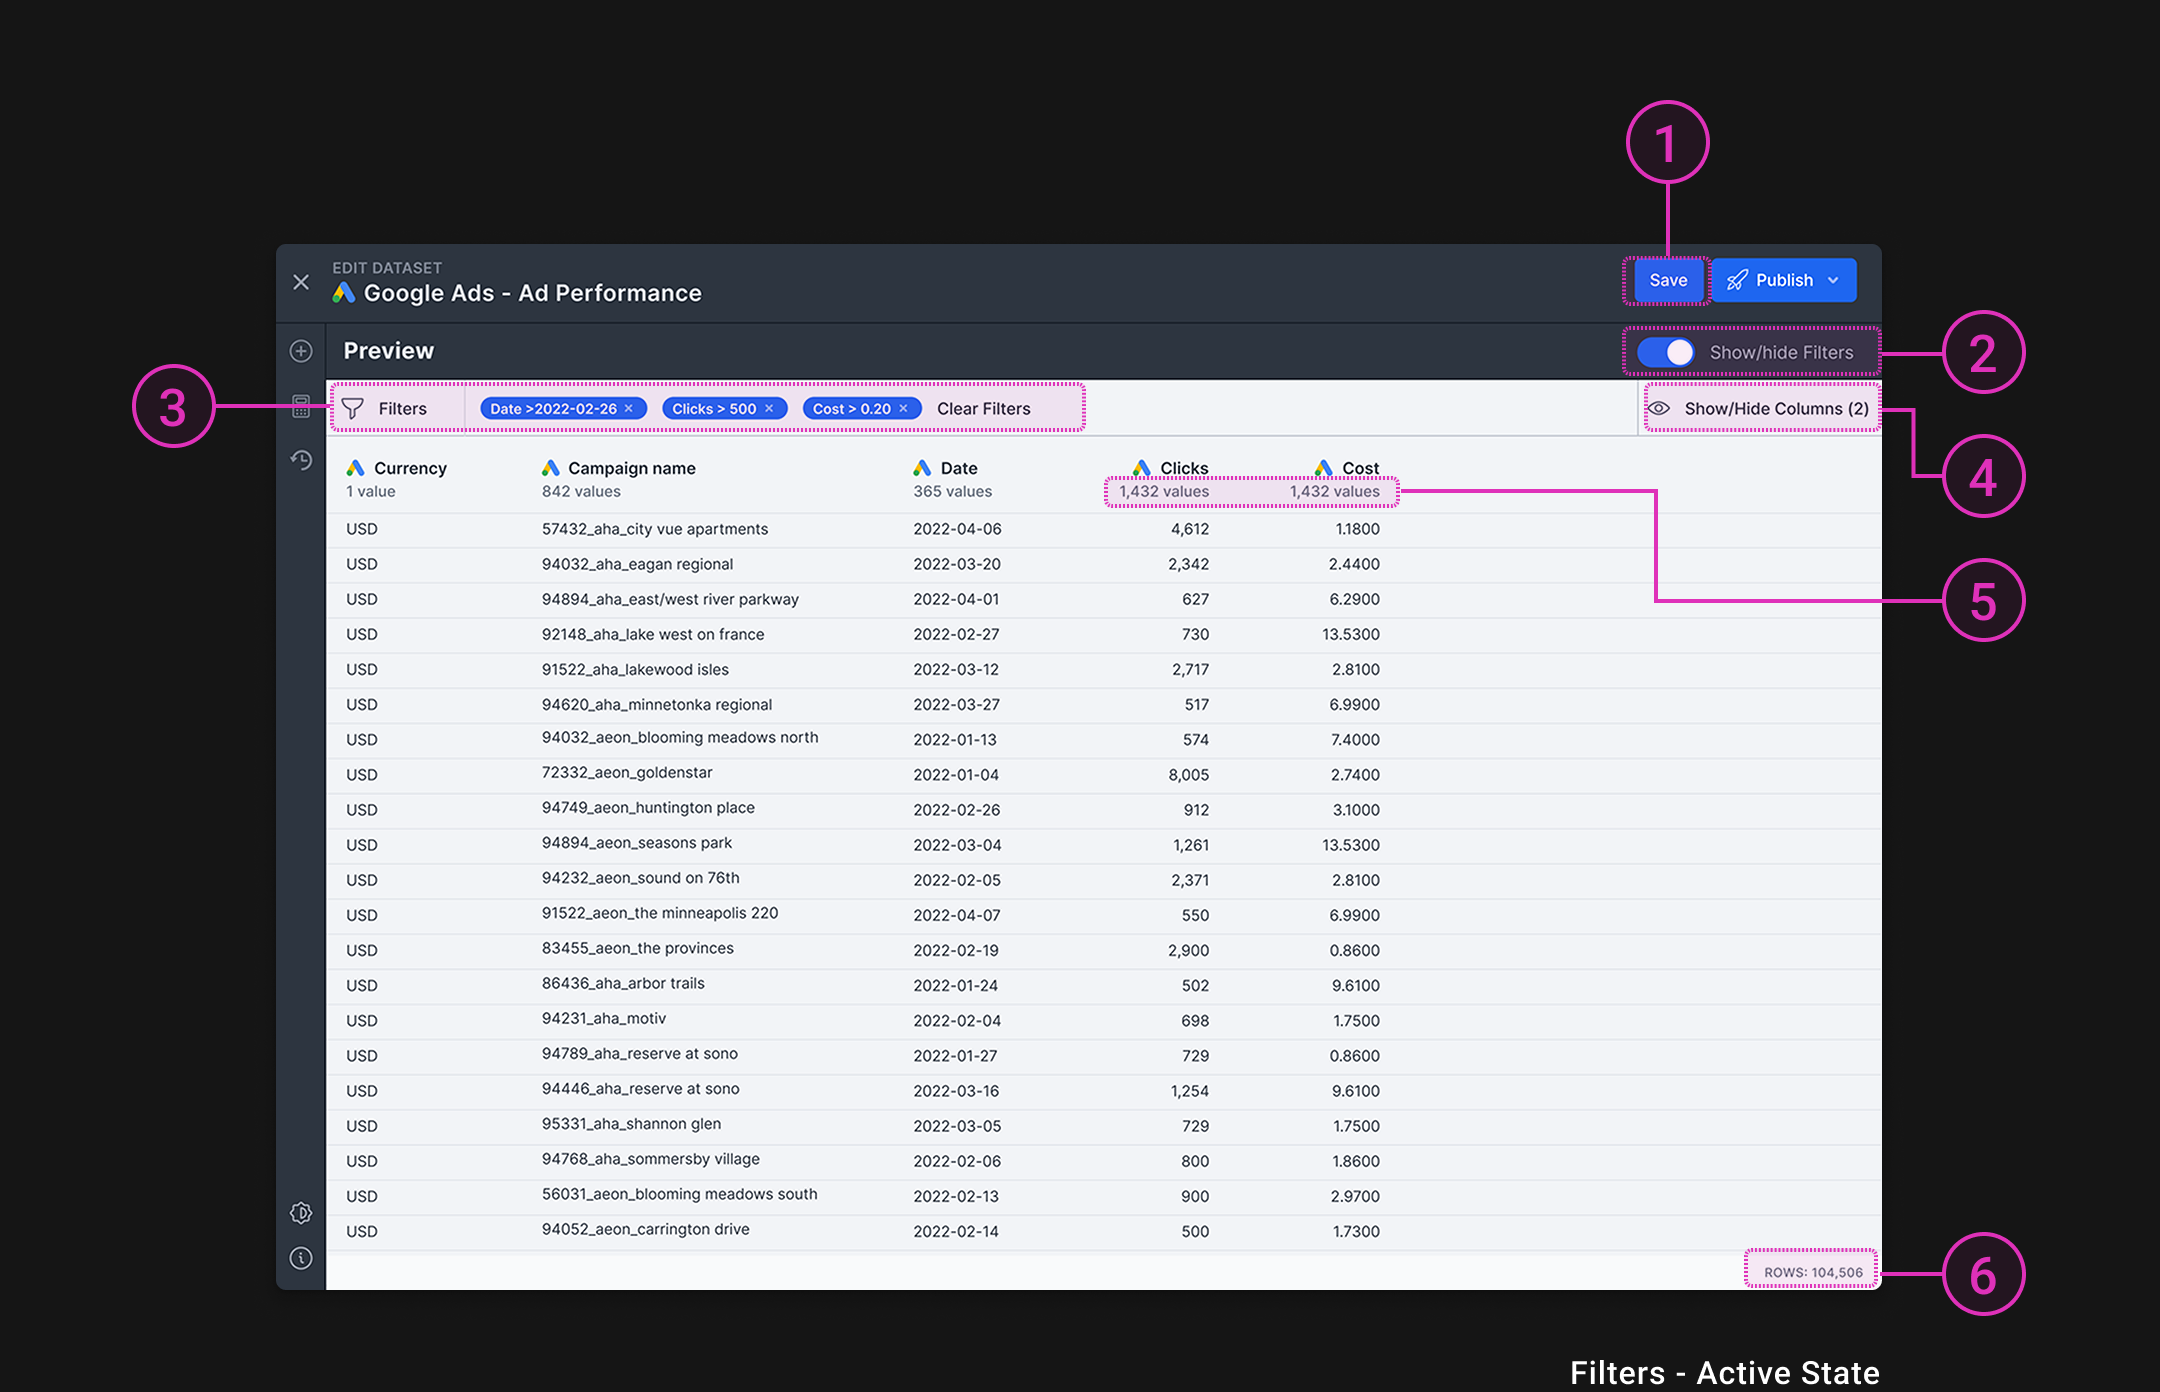
Solution: Visual Transformation Builder
We developed the Visual Transformation Builder—a centralized interface for data cleaning and exploration within NinjaCat. This eliminates the need for external tools like Tableau by bringing data preparation directly into the platform.
Testing
We conducted two rounds of moderated remote testing with a total of 8 existing users, each test lasting about 45mins. Users were tasked with exploring large data sets and providing feedback on how they could identify and clean data anomalies using the Visual Transformation Builder. In the first round, conducted with 5 users, we discovered they misunderstood the exploration tools as making permanent changes to the data set. After updating the prototype, new users tested it and immediately grasped that the tools were temporary filters to identify data problems, showing a clear improvement in user understanding and engagement.
What Worked Well
- Users found data exploration tools (filtering, sorting, hiding columns) intuitive and natural
- (4 of 5) users supported cleaning and manipulating data at the dataset level
- Clear visual hierarchy helped users understand how components work together
Areas for Improvement
- The save button makes users think filters will be saved permanently
- (4 of 5) users didn't understand the purpose of toggling filters
- (3 of 5) users thought filters would be permanent changes to the dataset
- (3 of 5) users thought show/hide columns is the same as show/hide filters due to their close proximity
- Showing unique values for number and date columns did not create much value to users
Technical Constraints
- To prevent slow loading times, we can start by showing 1,000 rows of data first

What Worked Well
- (3 of 5) users thought the text bar chart was useful when they want to quickly identify data discrepancies.
- Users thought AVG, SUM and EMPTY are all good information to check for data anomalies
Areas for Improvement
- Most users preferred expanded list for easier scanning
- Most users found Number and Date column charts unhelpful
Technical Constraints
- Loading data each time a user clicks a column slows down performance.
Deliverables, Outcome, Learnings
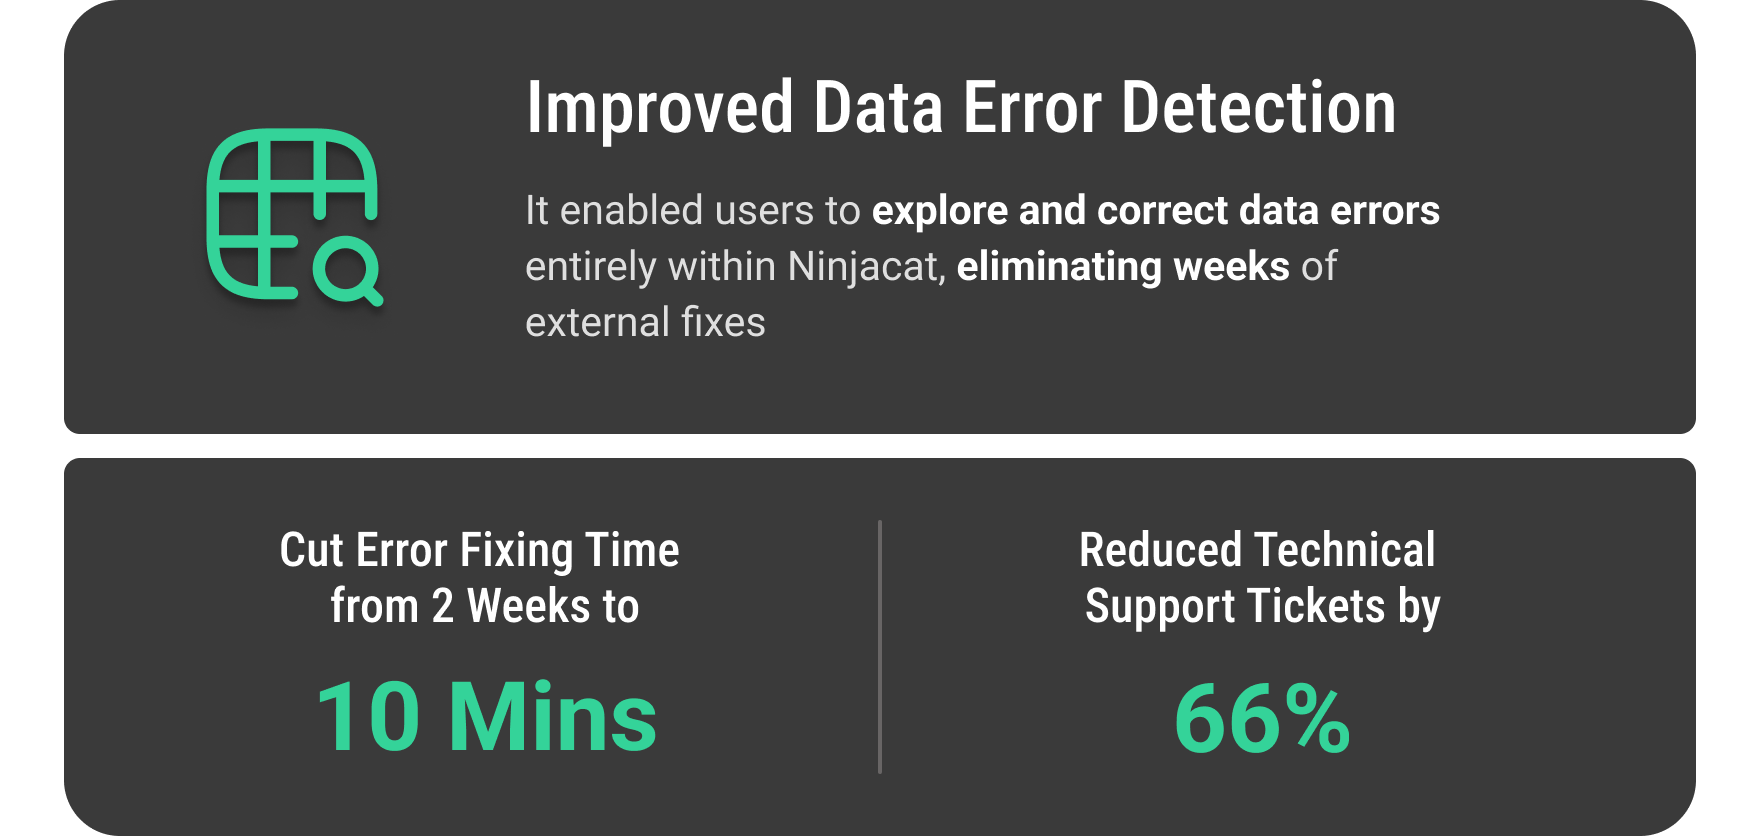
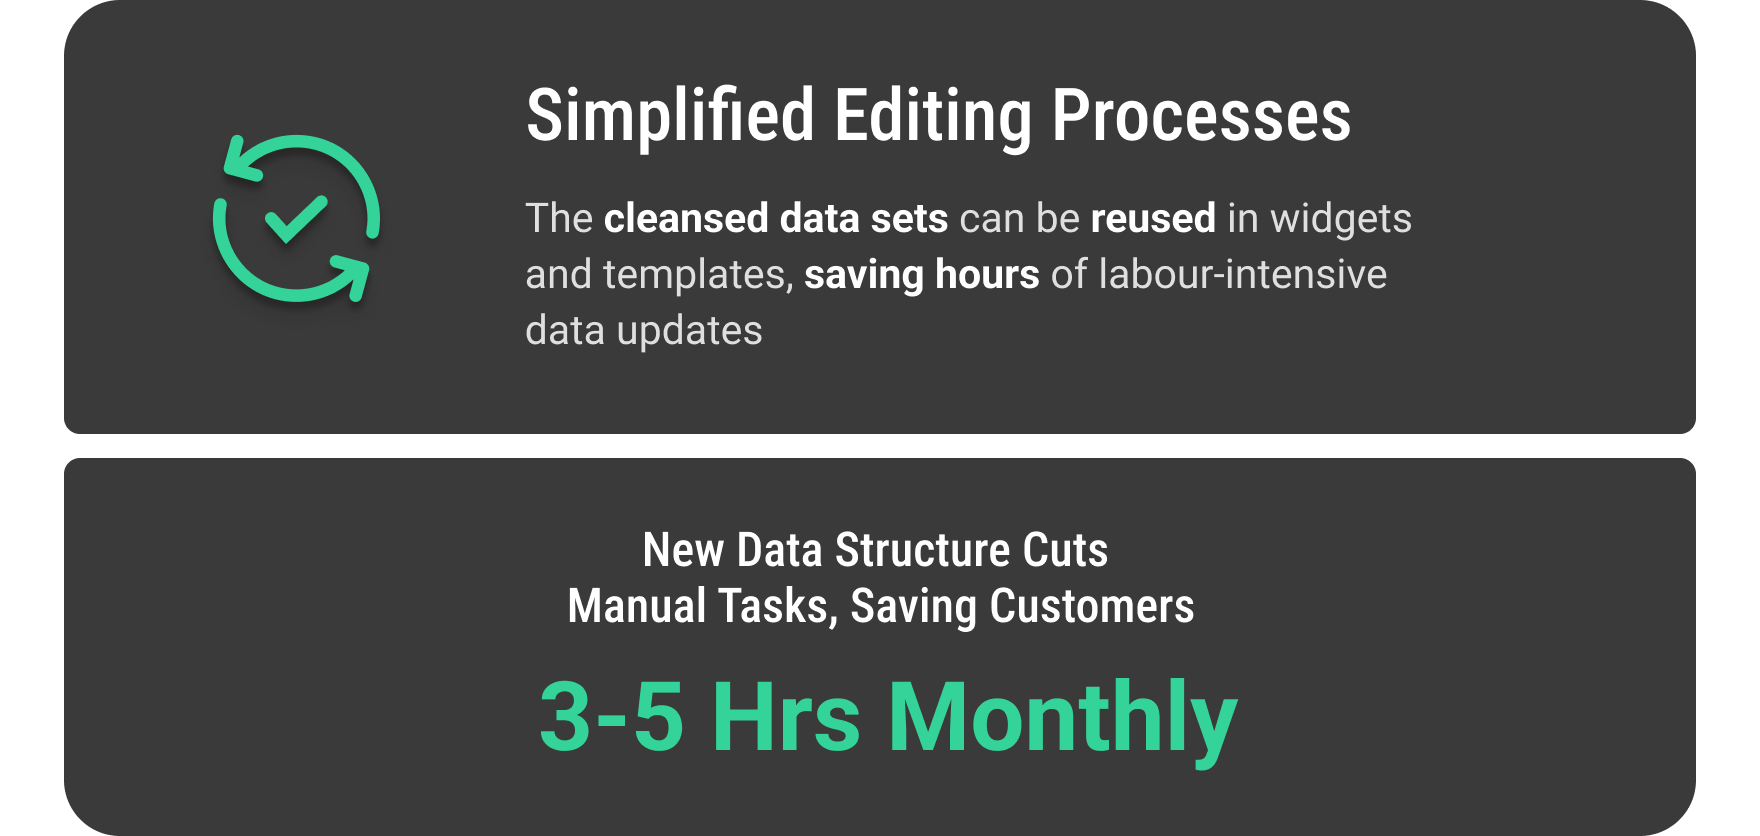
Outcome
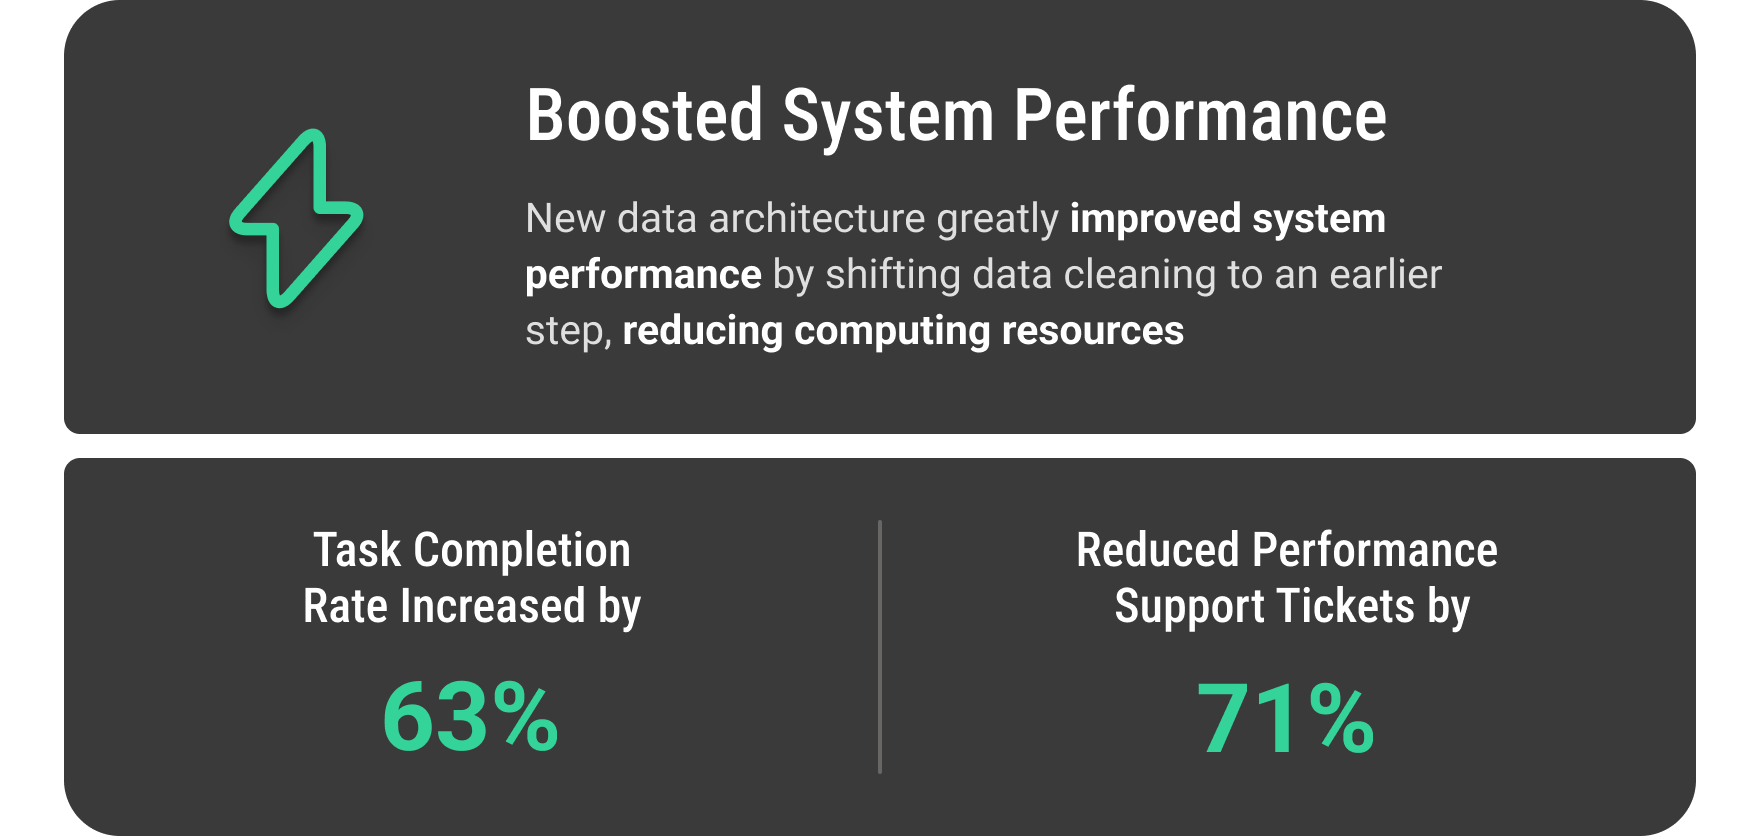
The shipped designs, including the Visual Transformation Builder (VTB) and new data architecture, solved the original 3 problems by the following:
Reflections
Technical Foundations Matter
Working with architects and the CTO showed me how NinjaCat's data architecture impacted user experience. As designers, we must advocate for technical improvements that enable better solutions.
Designing for Different Technical Abilities
User testing showed varying comfort levels with data manipulation. This insight sparked exploration of potential solutions, including the concept of AI assistance to make data tools more accessible to all users.